Unchanged but a lot really happened

July 15, 2022

Yesterday’s session very much resembled Wednesday with bears taking advantage of the low volume overnight session to press shorts and take the market lower. We attacked the open around the key 3740-3750 support and a few prints below were sufficient to trigger the stops hidden below. ES quickly traded to 3724 but the selling pressure rapidly abated once stops were cleared and the market moved back above 3740 by 11.25am. From there, bulls took control of the session and got prices back towards 3800. The SPX settled 0.3% lower, the NDX 0.34% higher and the DJIA 0.46% lower.

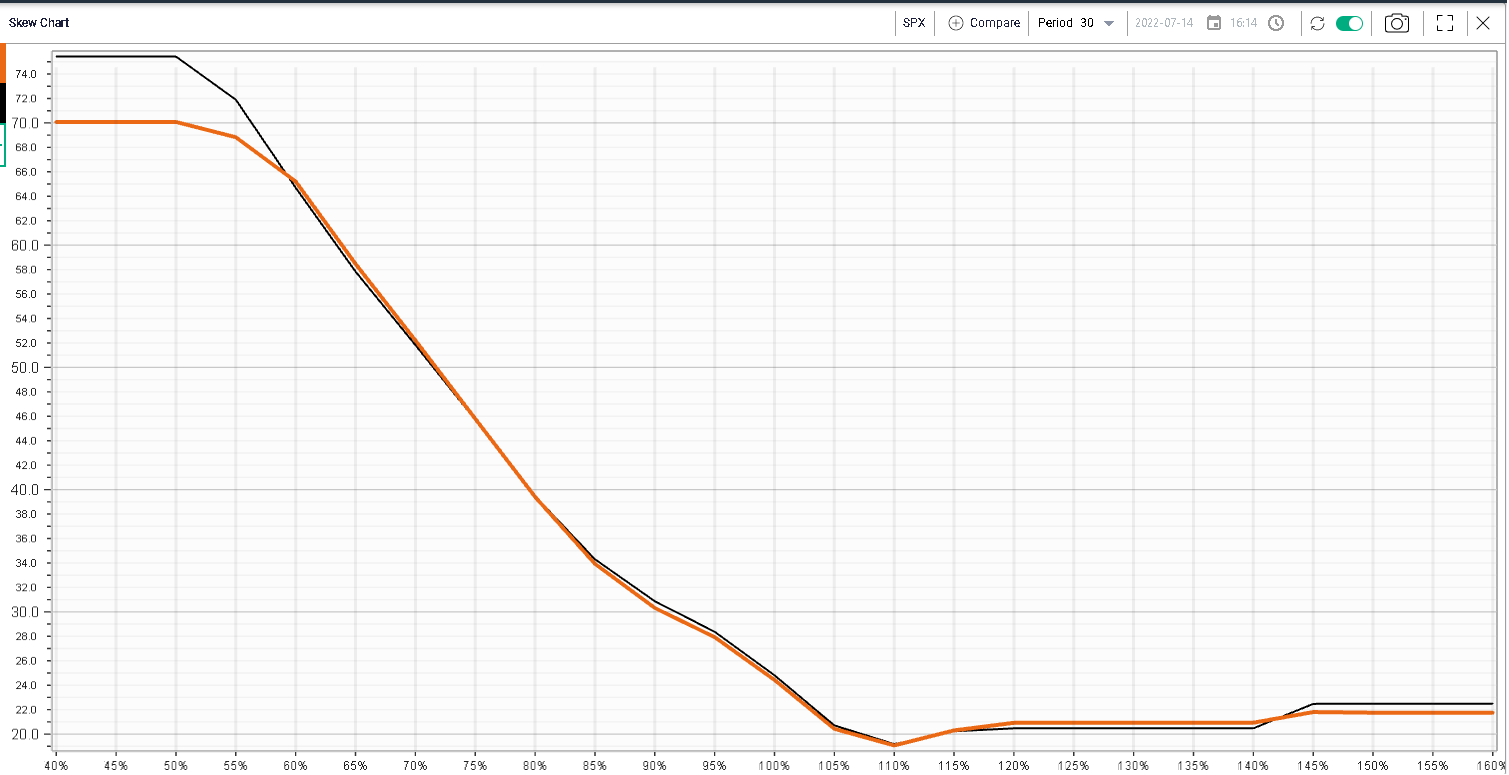
Implied volatilities were largely unchanged over the session as shown on the below 30d skew curve with in orange Thursday’s closing values and in black the skew as of Wednesday.

ivolatility spot price chart

Despite the index showing a very similar performance and price action on Wednesday and Thursday, underlying sectorial performances were very different.

Financials struggled with the sector losing almost 2% on the day, brining the 2022 performance to negative 22.2%. JPM was a notable laggard losing 3.5% as the company reported a more conservative set of numbers than anticipated. In particular, media reports focused on the build-up of reserves and the fact that JPM has temporarily stopped its share repurchases. Morgan Stanley also reported earnings but the company finished almost unchanged on the day despite missing numbers.

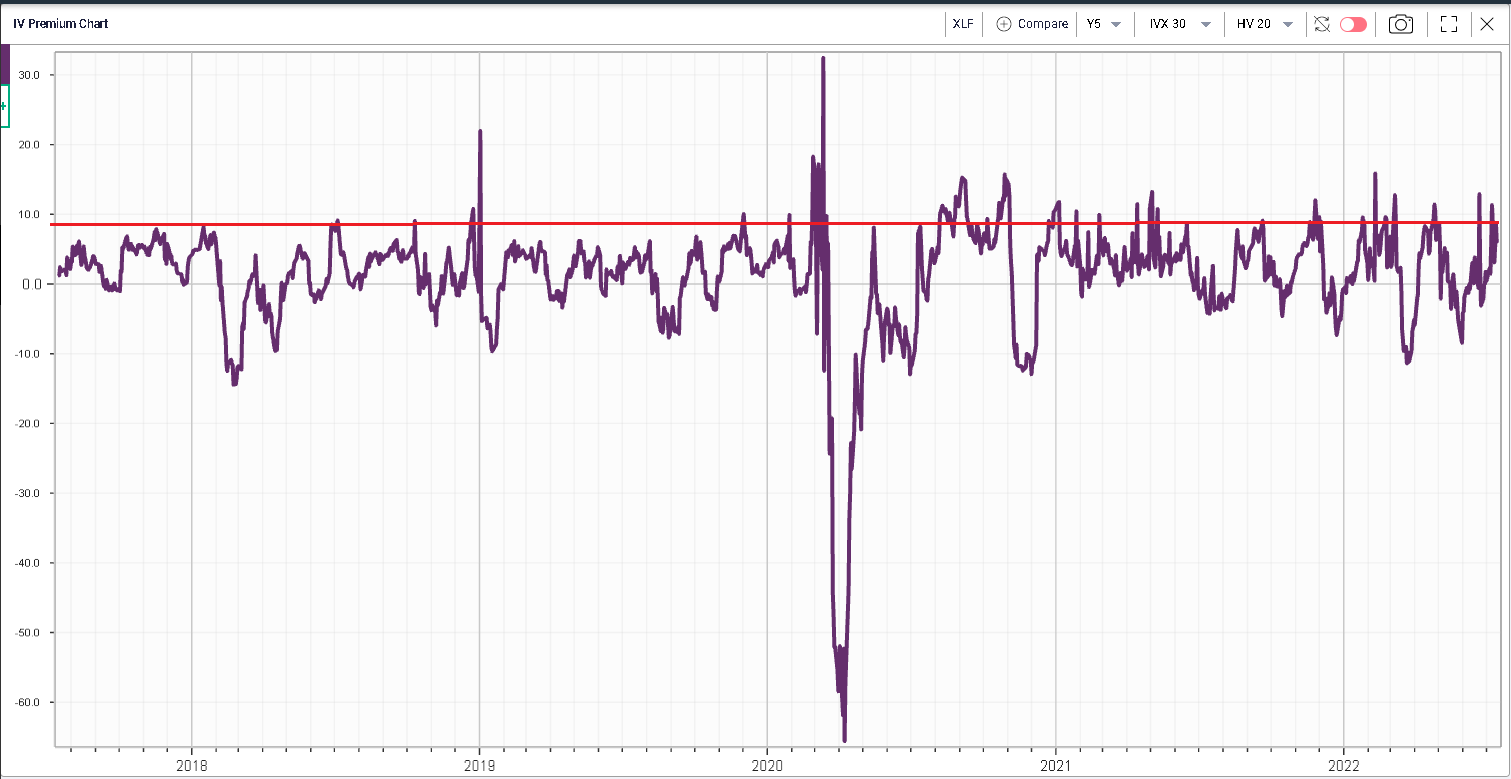
Looking at the XLF IV Premium (30d/20d), we highlight on the below chart the current position relative to the last 5 years of history in red. From that perspective, the implied volatility of the XLF looks relatively elevated.

Ivolatility spot price chart

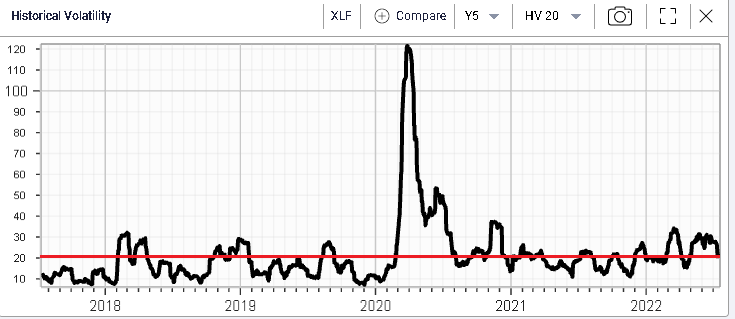
This is driven by the realized volatility of the sector which, despite yesterday’s move, has remained fairly low overall in 2022 hitting the 20% mark recently when measured over the last 20 days.

Ivolatility spot price chart

The energy space yesterday from another weak component losing 1.9% at the sector level. Note that the year-to-date performance of the XLE is now “only” 18% after being up as much as 66% at the beginning of June. Compared with USO, energy stocks seem to have lagged on the recent downturn despite trading pretty much in line for the best part of the last 12 months.

Ivolatility spot price chart

Media reports indicated about a month ago that the US government was considering implementing a windfall tax on energy companies and that might have weighted on sentiment around the sector.

From a volatility perspective, the implied and realized volatilities seem to trade around flat for the sector as shown on the below IV Premium Chart.

Ivolatility spot price chart

Finally, the materials sector was also under pressure losing around 1.8% on the day. APD lost 2.64%, LIN dropped 2%.

On the upside, all eyes were on the tech names with the sector gaining 1% on the day. AAPL managed to finish 2% in the green and NVDA was 1.4% higher by the close.

AAPL has dropped around 18.5% in 2022 so far and is exactly unchanged compared to a year ago. It is still up almost 300% over the past 5 years.

Ivolatility spot price chart

Implied volatility in the name has moved higher and is now trading around the 40% mark and when evaluated against the 20d HV as shown on the below IV Premium chart, we find that 30d IVX is around 10 points higher than 20d HV which is a relatively high level compared to the 5 years of history we show.

Ivolatility spot price chart Ivolatility spot price chart

AAPL is due to report on the 28th July so there might be some interest from traders to buy options going into the numbers although it has not yet transpired in our Open Interest tracker with the OI dropping continuously in 2022.

Ivolatility spot price chart
Disclaimer - This information is provided for general information and marketing purposes only. The content of the presentation does not constitute investment advice or a recommendation. IVolatility.com and its partners do not guarantee that this information is error free. The data shown in this presentation are not necessarily real time data. IVolatility.com and its partners will not be liable for any loss or damage, including without limitation, any loss of profit, which may arise directly or indirectly from the use or reliance on the information. When trading, you should consider whether you can afford to take the high risk of losing your money. You should not make decisions that are only based on the information provided in this video. Please be aware that information and research based on historical data or performance do not guarantee future performance or results. Past performance is not necessarily indicative of future results, and any person acting on this information does so entirely at their own risk.
Important Cookie Information
We use the minimal necessary cookies to ensure that we give you the best experience on our website. You must accept cookies in order to use our website. Learn more about privacy at IVolatility.
I Accept