Losers make a come-back, more to come?
July 21, 2022
For the past two weeks we have pointed out in the technical Monday market update the importance of the 3950 level for bulls as a pivotal level to open up more upside. The SPX managed to break 3950 and got to the top of the downtrend channel that had been in play for most of this year. Upon testing the upper bound of the channel, the SPX corrected lower but managed to hold above the 3950 level. As usual, we will discuss this in more details in our weekend note published next Monday but for now, suffice to say that the next few days price action will be crucial for the overall mood of the market.
Over yesterday’s session, the NDX gained 1.6%, the SPX 0.6% and the DJIA 0.15%. Overnight, in Italy, Prime Minister Mario Draghi resigned paving the way for snap elections over the next few months. This development will bring an unwelcomed round of political instability in Europe at a time when the zone already has to deal with a weak Euro, the impact of rising rates, an energy crisis and a war at its borders.
As a result, it is not entirely surprising that volumes on puts in FEZ have exploded over the past few days. FEZ is a USD denominated ETF tracking a diversified basket of Eurozone stocks.
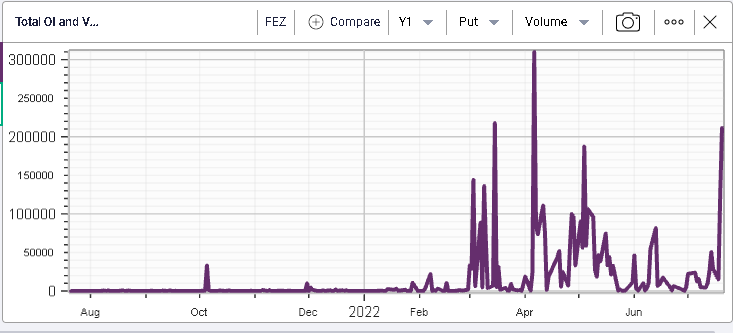
Traders are getting increasingly nervous about the situation in Europe with a recession towards the end of the year looking more likely by the day, especially in the event of Russia cutting gas supplies. On that last point, the market felt slightly reassured over the past few days as, following a scheduled maintenance, the tap started to run again albeit at a slow pace of around 40% of the requested amount.
Over in the US, TSLA reported numbers that look relatively in line with trader’s expectations. In the overnight session, the stock was up about 2%.
Looking at sector distribution yesterday, some of the biggest losers on the years were amongst the best performers on the day. For instance, the communications sector was up 1.65% (-26% year to date), the technology sector was up 1.56% (-22% YTD) and the consumer discretionary space was up 1.64% (-27.6% YTD).
Looking at open interest in those three sectors, we have the communications space in purple, the technology sector in red and the consumer discretionary space in blue.
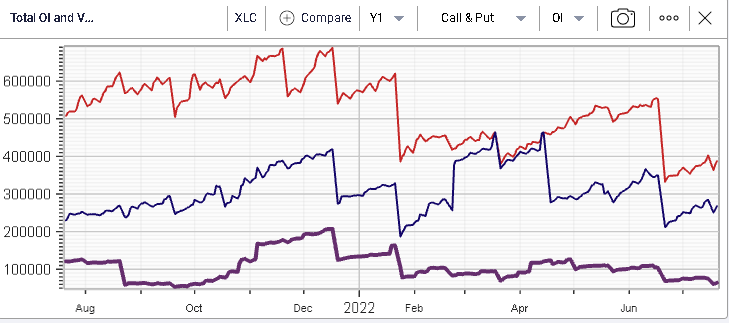
On the above, we can see that the move in the underlying spot prices has not been followed by any meaningful move in the underlying open interest.
On the downside, utilities finished 1.33% in the red while healthcare closed 1% lower. Both were respectively -3.6% on the year and -8%.
The same logic was visible within the components of the DJIA with the more speculative parts of the market raising over the day, for instance:
- CRM +5% vs -29% ytd
- DIS +3.75% vs -34% ytd
- NKE + 1.76% vs -32.5% ytd
- MRK -2.93% vs +16.63% ytd
- VZ -2.74% vs -6.43% ytd
- UNH -2.62% vs +3.42% ytd
Put simply, there has been some form of rotation throughout yesterday’s session with traders booking profits and seemingly reinvesting the proceeds into the most beaten down segments of the market.
In fact, we can create a basket made of the three winners ytd and the three losers ytd that we mentioned above to get the following value of $100 invested a year ago equally into each of those stocks.
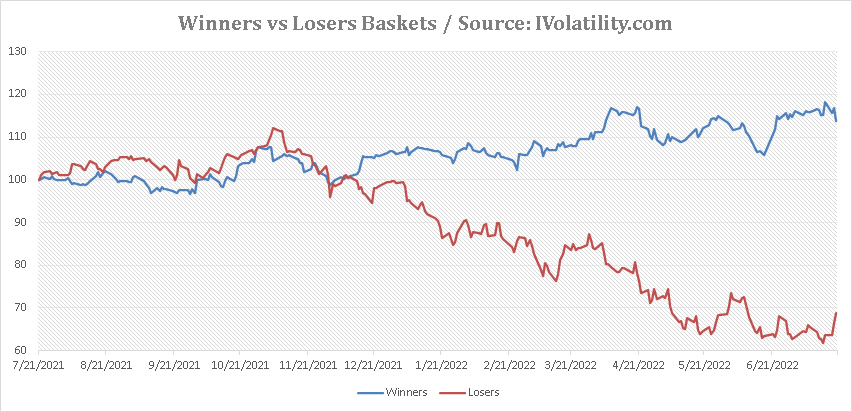
We can see the tilt over yesterday’s session of the losers moving back up and the winners moving lower.
Finally, looking at the difference in $ value of the winning basket and the losing basket, we show the very large convergence that was witnessed yesterday. This move was the largest single day move for those simple baskets that we have seen over the past 12 months.
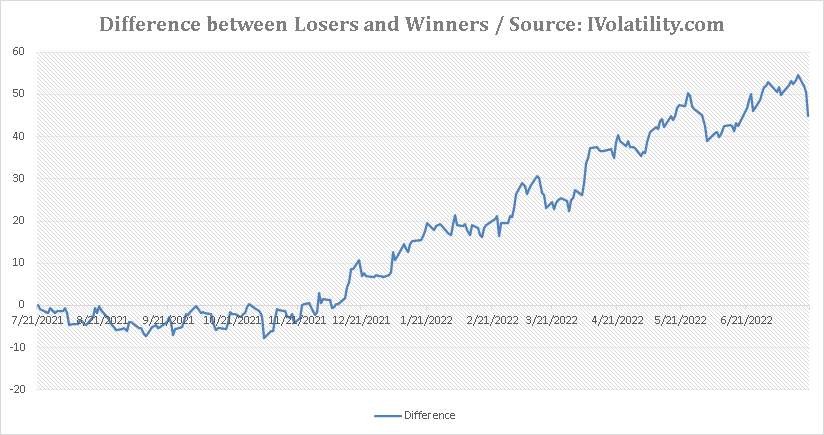
This is a very important signal to watch in the coming days in order to evaluate whether traders are now starting to feel more confident about the future and willing to put money back to work into the names that were most hit in 2022.