SPX stuck, are traders selling strangles?
July 25, 2022
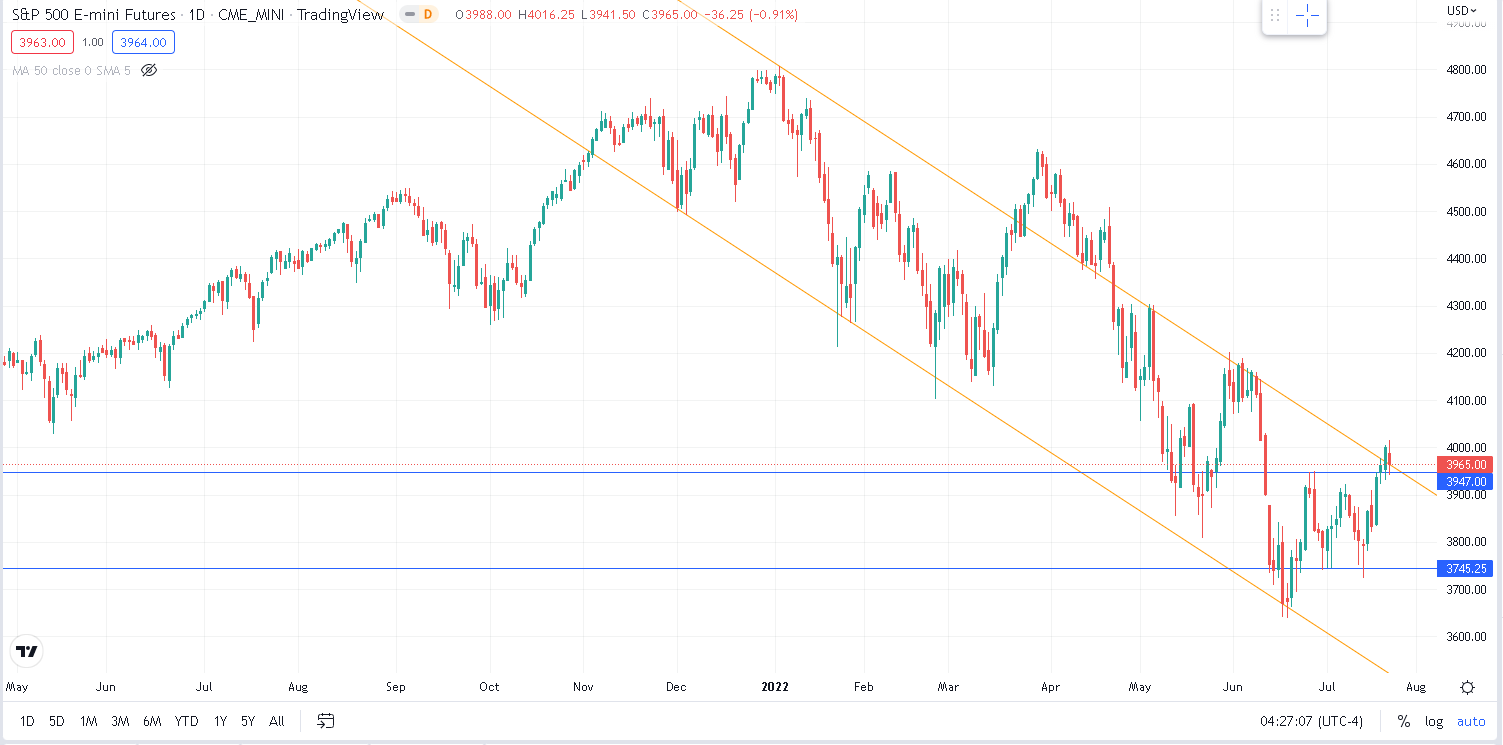
In last Monday’s technical update, we looked at the market being in the 3750-3950 range with bulls seemingly pushing for a break on the upside. Last week delivered exactly that with the SPX gaining 2.5%, the NDX finishing around 3.5% in the green and the DJIA gaining slightly less than 2%.
Source: Tradingview.com
The chart above shows the two major hurdles that bulls have had to deal with over the past 5 sessions. The below chart is a 15 minutes chart showing the intense fighting that took place around two key levels that happened to converge towards 3950.

First the 3950 resistance level saw bears mobilize and defend the level, but the big one was really the downtrend that has been in place over all of 2022. The fighting around the orange line lasted for 2 entire sessions going through periods of high volumes and periods of low volumes and giving each camp very little opportunity to unwind some of the positions taken as the market remained glued around 3950-3960.
Around the open on Thursday, it seemed that bears had run out of ammo and the SPX broke free to test 4000, another large psychological hurdle. By the open on Friday, it seemed that bulls had won as ES was trading firmly above 4000 but prices were pushed lower on high volumes and the selling only stalled as we approached the 3950 support which we managed to hold by the close. It is quite possible that after such an intense fight, bulls felt like reducing their overall positions as the market finally broke above 3960. This may well have contributed to the selloff seen on Friday with the market respecting the break area of 3950-3960 which is probably where a lot of the most recent short-term traders accumulated their positions.
Source: Tradingview.com
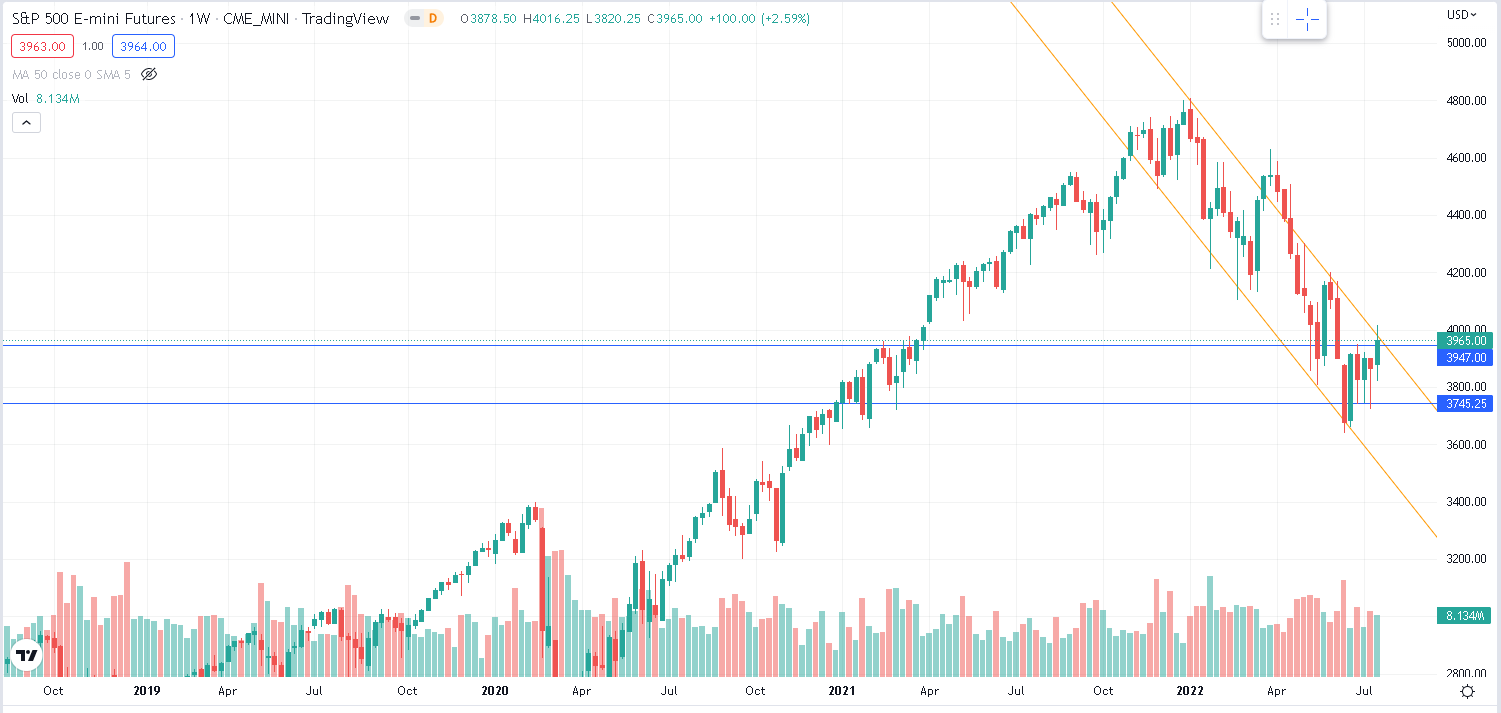
On the weekly chart above, we can see that the market managed to both break out of the recent range while remaining within the downtrend channel established in 2022.
The focus for next week will be whether bulls have a firm grip on the market and remain able to preserve the 3950 support. Some key hurdles will need to be cleared for good with the downtrend still in place as well as the key psychological 4000 level.
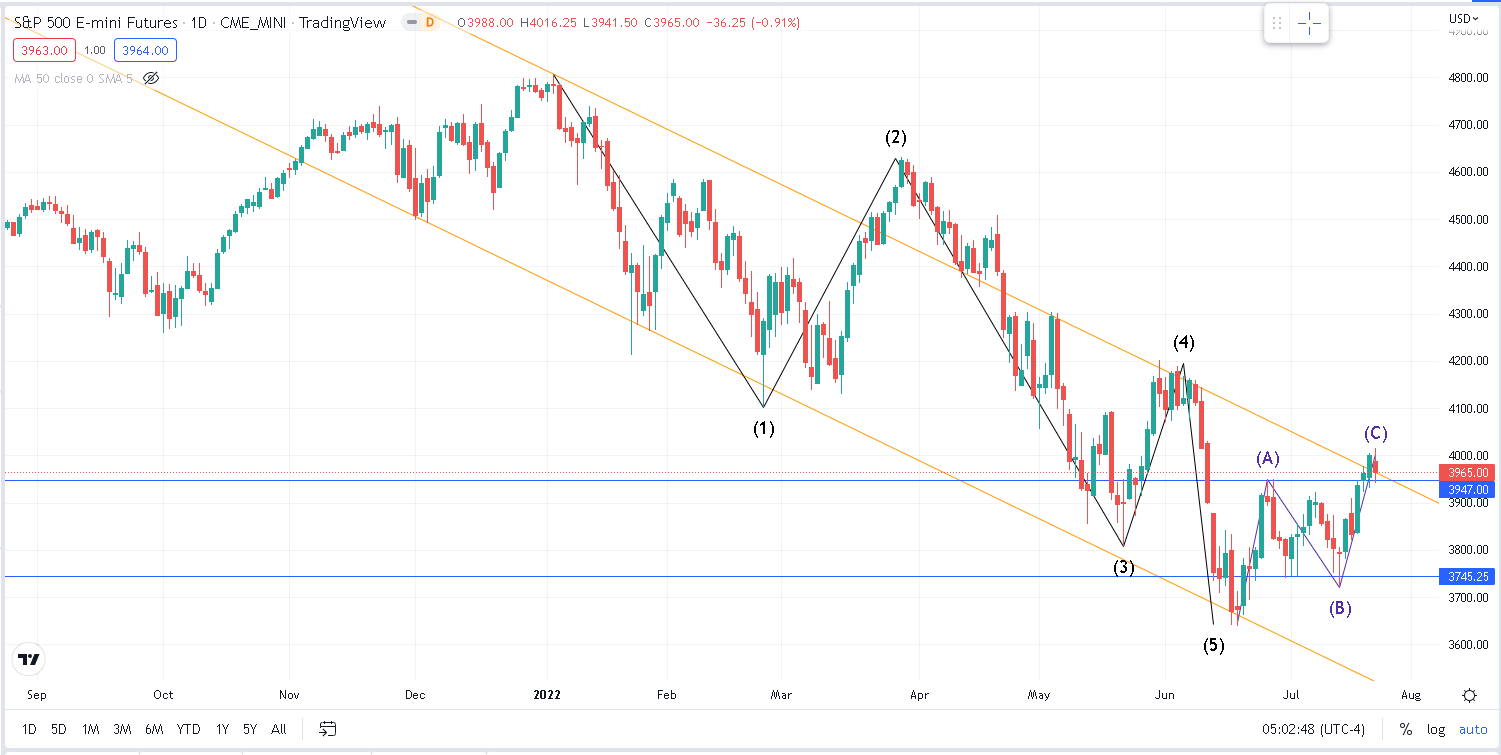
As we see on the below chart, we can describe the selloff this year as being essentially made of a 5 waves impulsive move that is now completed and followed by a 3 waves corrective move that could also be seen as completed as we have now broken the previous local highs of 3950.
Source: Tradingview.com
At this point it is very difficult to know which camp will take the upper hand. Since the June expiration, bulls have managed to get signification concessions from bears and pushed prices from the 3650 area back to 4000 but the type of price action seen on Friday will keep some worried. Wait and see is probably what most traders will decide to do for next week especially considering the highly anticipated FOMC meeting that could swing prices either way. For bears, getting prices back below 3950 will be an important first hurdle. On the below chart, we look on a 15 minutes timeframe to identify some of the levels that might come in play should bears manage to push prices back below 3950.

Source: Tradingview.com
Levels highlighted are: 3900 – 3874 – 3822 – 3770 – 3749
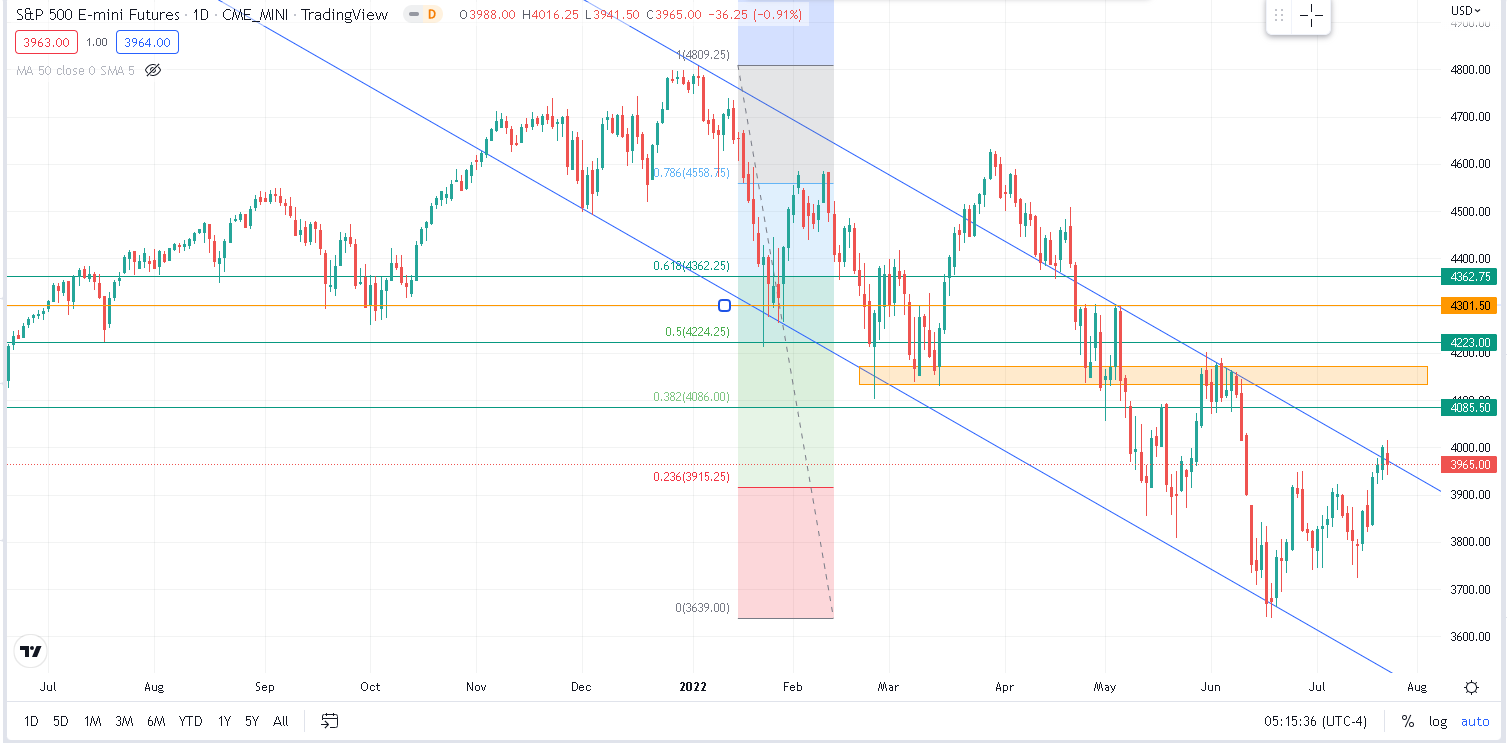
On the upside, as we are entering territory that has not been visited since the beginning of June, short timeframes are not helping us very much.
Source: Tradingview.com
Looking at longer timeframes, we look at the following levels: 4085 – 4135 to 4165 zone – 4223 -4300 – 4360 as highlighted on the above chart.
Looking at implied volatilities over the week, those continued to deflate with 30d IVX dropping 1.8% over the week to finish just above 20%.
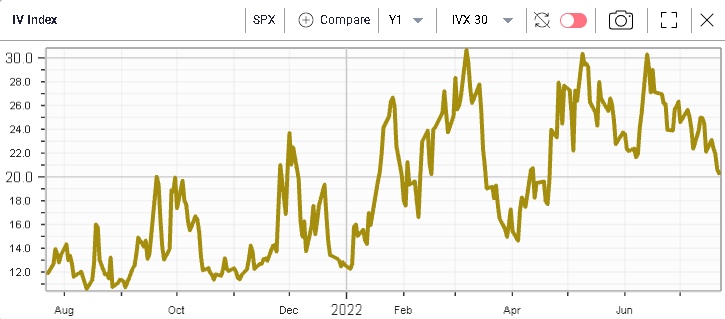
For the NDX, 30d IVX dropped 1.6% and settled around 26.6% on Friday.
Looking at the flows over last week, there seemed to be some focus on SPX end of month options. Over the week we saw:
- 20.6k of the 08/31 4200 calls
- 17.8k of the 08/31 4100 calls
- 26.6k of the 08/31 3800 puts
- 27.6k of the 08/31 3600 puts
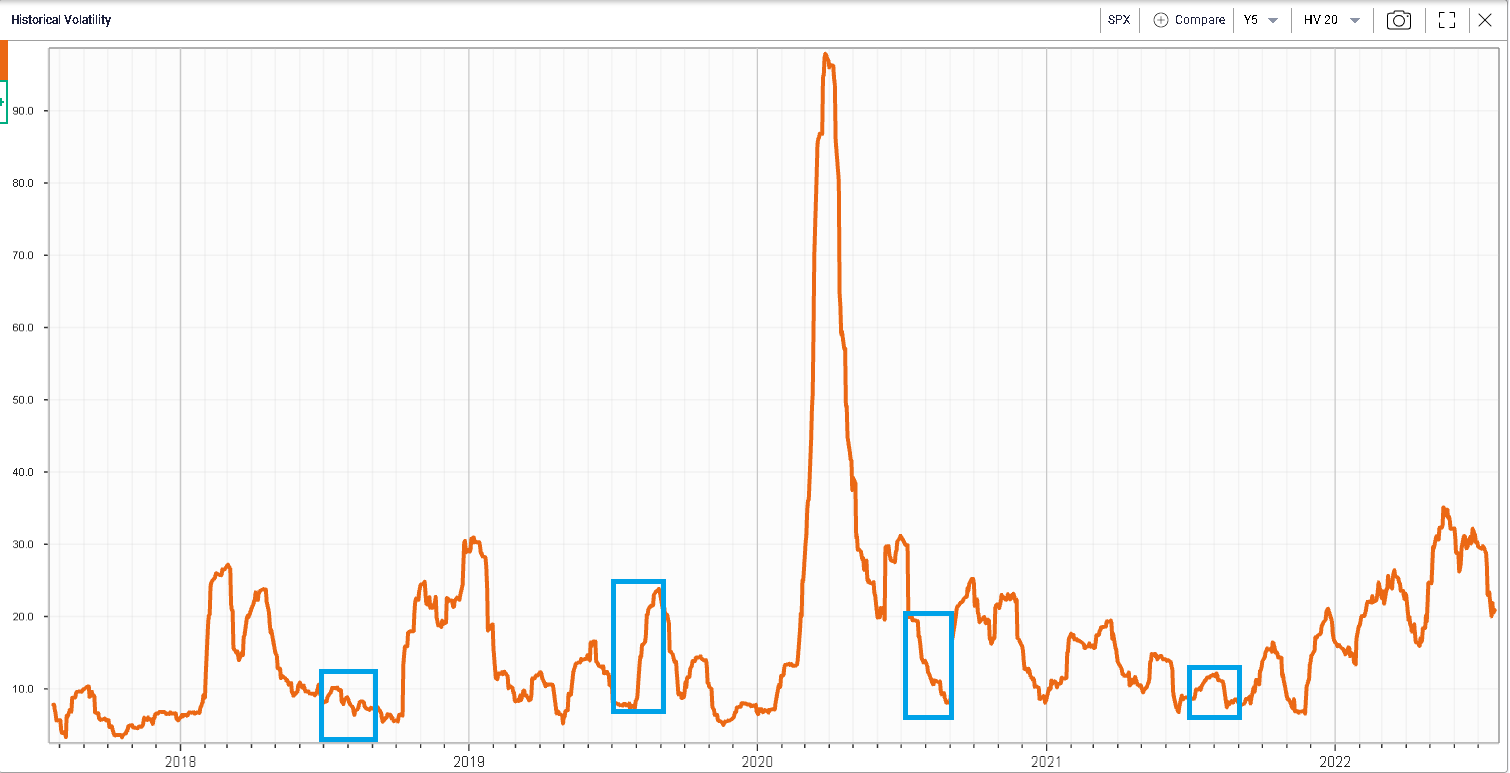
On the below chart, we highlight the summer period for historical 20 days realized volatility. With current 30d IVX around 20% for the SPX, it looks as if the market has generally failed to reach that level during the summer period over the past 4 years so it is possible that some traders might be looking to sell options, trying to take advantage of a potential summer lull as traders take time off.
If some users like the logic, they should turn to the RT Spread Scanner in order to find the structures that deliver the best risk/reward profiles.
The system would then suggest looking at the following structures as being the most attractive from a risk to reward perspective.
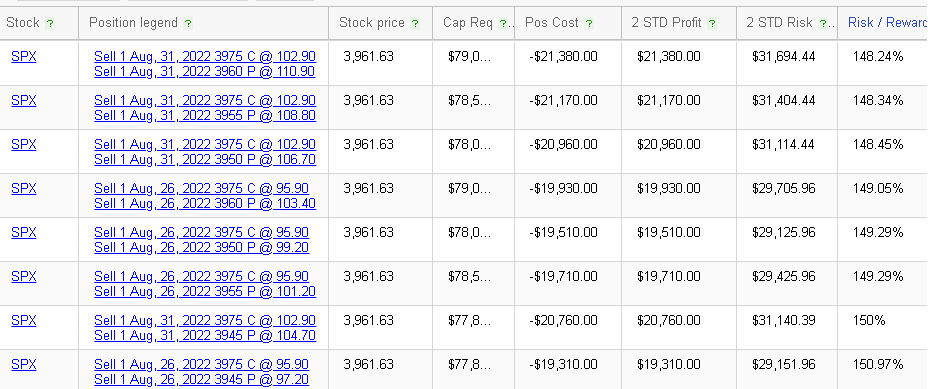
We can see here that selling the SPX 3960/3975 strangle would yield a potentiel profit of $21,380 should the SPX finish exactly between 3960 and 3975 with a 2 standard deviation risk of around $31,694 should the market start to move against the structure.