3950 holds for now
July 26, 2022
3950 was tested on multiple occasions on Monday but bulls managed to get prices back above the key level before the close. With a high-low range of around 30 points, bulls and bears seem to be waiting, possibly for the FOMC on Wednesday before starting to add or reduce to their positions.
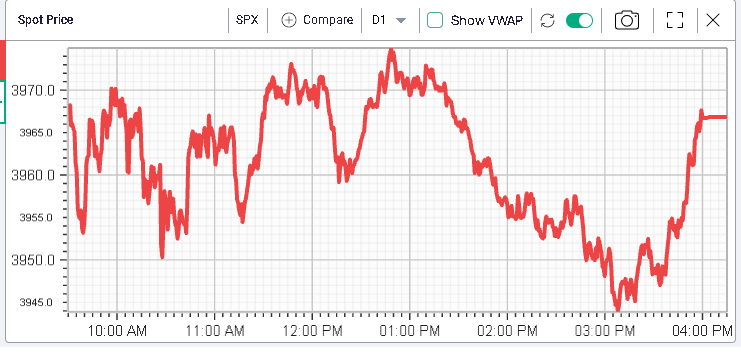
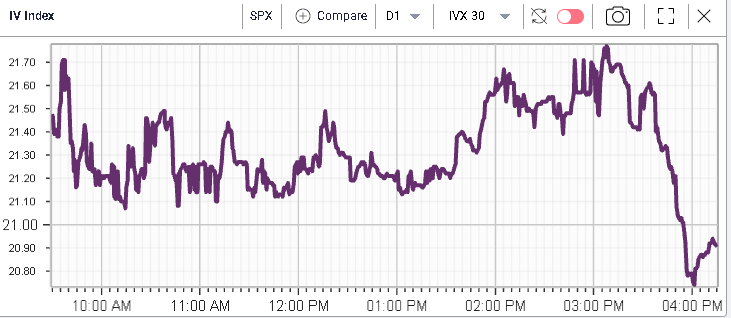
Despite this upcoming event, implied volatility was remarked lower yesterday with 30d IVX settling below 21 and significantly underperforming spot prices.
Over the session, the SPX gained 0.13%, the NDX lost 0.55% and the DJIA gained 0.3%. In Europe, the market got worried early on about the cutoff of Russian supply via Nord Stream 1 to 20% of capacity against 40% before.
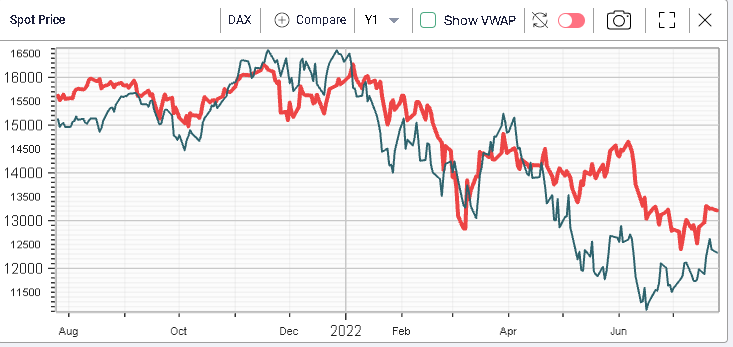
European stocks managed to recover anyway although ever since the market started to worry about a potential recession in Europe and a significant energy crisis towards the end of the year, the outperformance of European stocks against US counterparts has shrunk as seen on the below DAX/NDX spread chart.
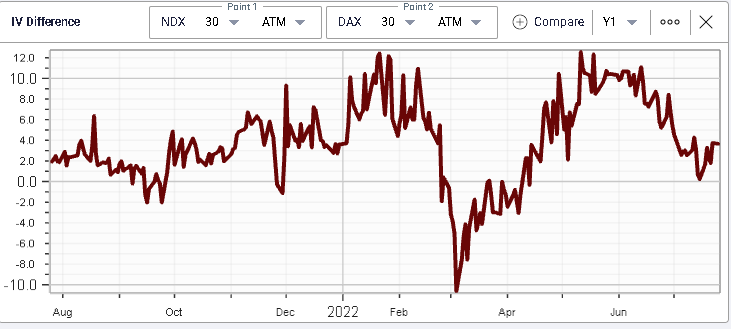
The same has been visible on the implied volatility of the NDX and the DAX. Below we show the 30d implied volatility (ATM) difference between the NDX and the DAX. In around a month, that spread has compressed by about 10%, a significant move that could be read as an increase in the risk perception of European assets.
Looking at the DJIA components yesterday, the performance of stocks was quite dispersed. Tech names were under pressure to start the week with CRM losing -2.84%, AAPL -0.74% and MSFT -0.59%. MCD also lagged losing -1.42% and BA was down -0.96%. On the upside, CVX gained almost 3%, TRV +2.28%, CAT +1.79%, UNH +1.55%.
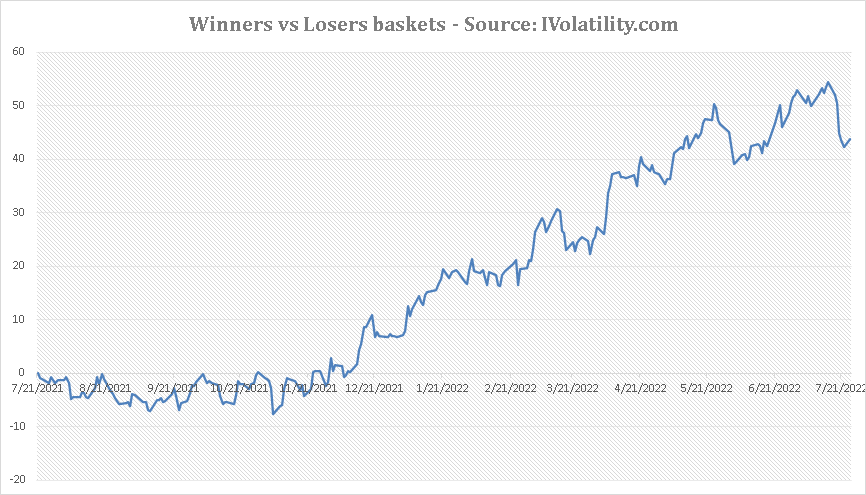
Looking at the winners vs losers baskets that we introduced last week, we see that the outperformance of losers has now stopped and started reversing yesterday. This reversal could be technical after a solid compression or could be a sign that the market bounce has run its course and that traders are no longer interest in buying/covering laggards at those levels.
Overall, it seems that over the next few days, traders will continue to look for clues regarding the direction of the market both technically and fundamentally.