FED delivers, MSFT reassures
July 28, 2022
The FED delivered a 0.75% rate in a unanimous decision hike as largely anticipated by market participants. Now that the “easy” part is largely done (probably includes a further 1% by the end of the year according to economists), the market’s internal debate around the future path of rates will take center stage once again.
The debate is likely to be around how much more can the FED do before it starts impacting the economy and to what extent it might eventually have to start cutting rates down the road as the economy weakens possibly next year.
Chair Powell acknowledged in yesterday’s press conference that the pace of rates hikes would likely slow partly to let the FOMC evaluate the impact of their initial action.
Markets welcomed what was generally perceived as a more dovish conference than before and all three major indices finished in the green. The SPX closed 2.62% higher, the NDX gained 4.26% and the DJIA 1.37%.
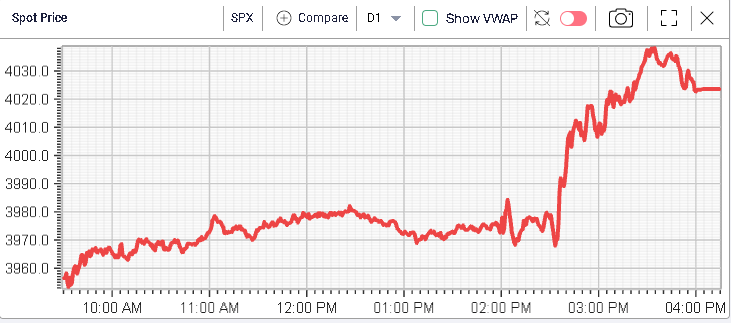
In the prior overnight session, the market remained under 3950 but by the open bulls had managed once again to get prices back above this key level which was preserved throughout Thursday’s session.
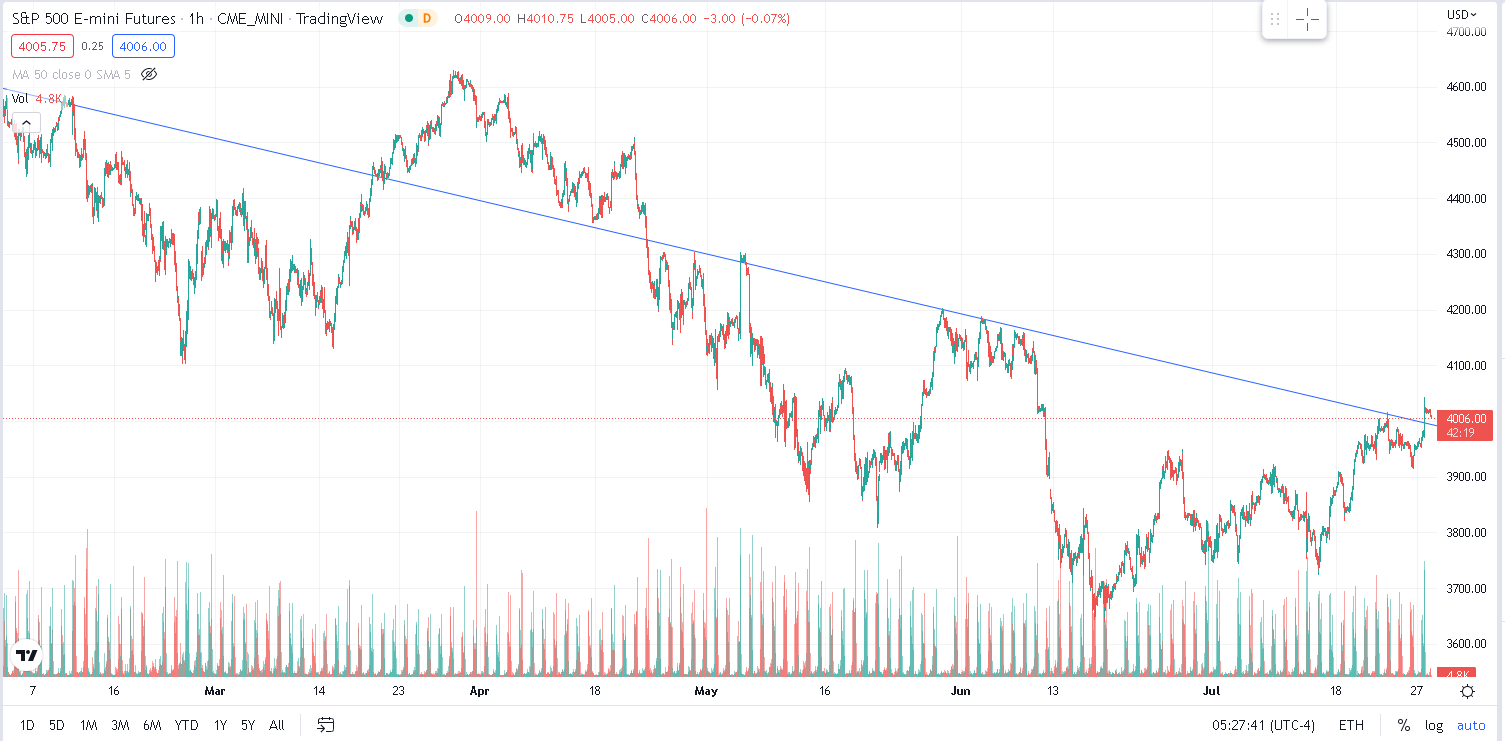
We will look at market technicals in more details over the weekend and report back in the market update that will be published next Monday but for now, it is interesting to note that the SPX has broken out of the trendline that had worked for a large part of this year, particularly since May.
Implied volatilities dropped significantly over the session, unsurprisingly led by the front-end with 30 days implied volatility losing 1.2%.
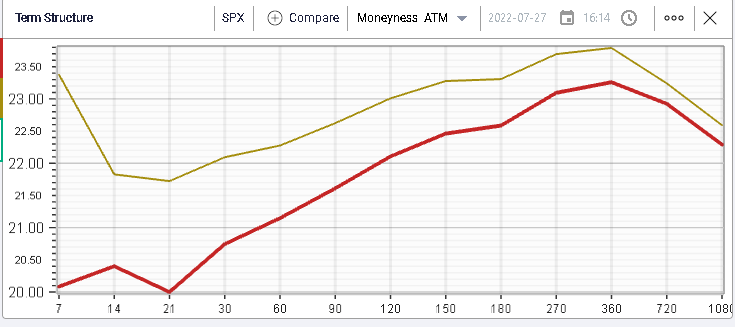
The market seems fairly comfortable with yesterday’s announcement and we will have to watch price action and flows over the rest of the week to confirm whether a shift in perception is underway.
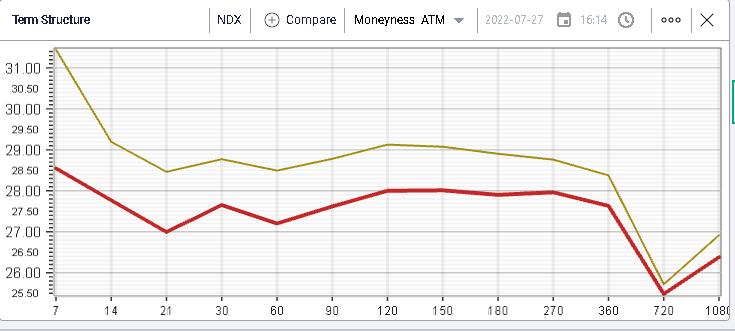
The market reacted approximately in the same way for the NDX but remained slightly more cautious in the front-end with short dated vols still between 27% and 28%.
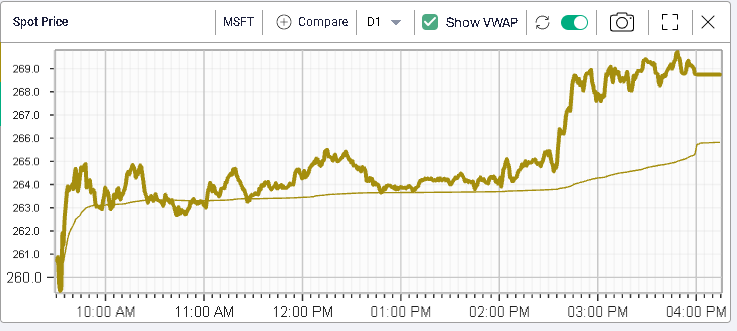
Looking at DJIA components, MSFT really stood out yesterday as the best performer of the index gaining 6.7% on the day. Traders were worried that the overall economic situation as well as the USD strength could impact the companies’ revenues but the guidance seemed to remain optimistic and gave a confidence boost to investors.
The stock traded above VWAP all day and any pullback towards it was swiftly bought a sign that investors were keen to accumulate the stock.
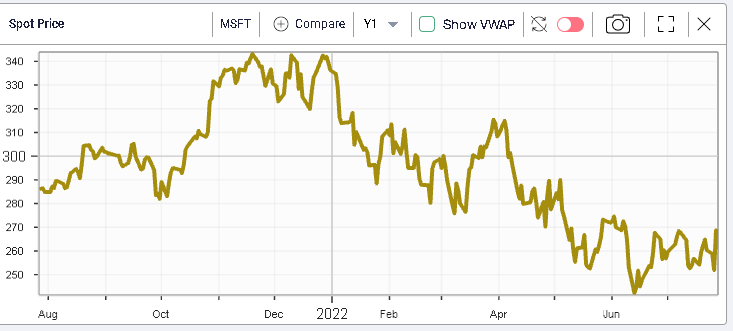
Looking at the last 12 months of daily spot prices, we can see that the name remains very low historically down -20% on the year.
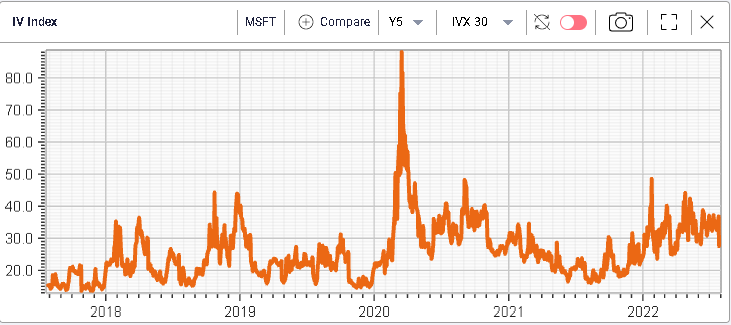
Implied volatility in the name remains towards the upper end of the range compared to the last 5 years showing that investors, whilst optimistic about the latest piece of information remain cautious on the name.
Looking at the RT Spread Scanner to identify some structures, we can search for bull vertical spreads on MSFT. The system returns the following list.
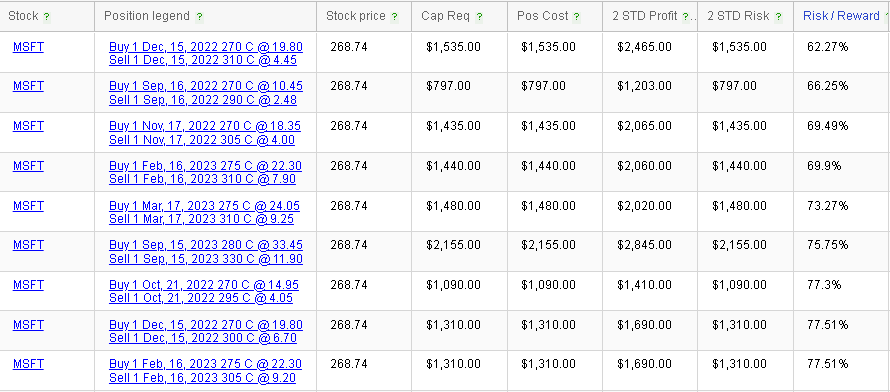
For instance, a trader looking to play MSFT until the end of the year could look at the Dec’22 270/310 bull spread. The total cost of the structure would be $1,535 for a 2 standard deviation profit of $2,465 given a risk to reward ratio of around 62.3%. Once the trader has defined the view to play (bullish, neutral or bearish), that tool can be of tremendous value to identify the most attractive structures based for instance on risk/reward. Should you need help getting started, do not hesitate to reach out on support@ivolatility.com