Signs that traders are buying calls in SPX
July 29, 2022
Markets continued to push higher yesterday with the SPX gaining 1.2%, the NDX +0.9% and the DJIA +1%. Europe also performed well with the French CAC leading up 1.3% and the German DAX up 0.8%. Implied volatilities continued to deflate dropping between 1% and 2% on the 30 days bucket.
The sectorial performance was different from what was observed the prior day with utilities leading and settling +3.6%. Industrials also performed strongly gaining 2% over the session. The only sector that was lower on the day was the communications space, dragged by Meta which lost 5.2% over the day after the company reported a revenue drop for Q2.
Within the DJIA, the best performers were respectively:
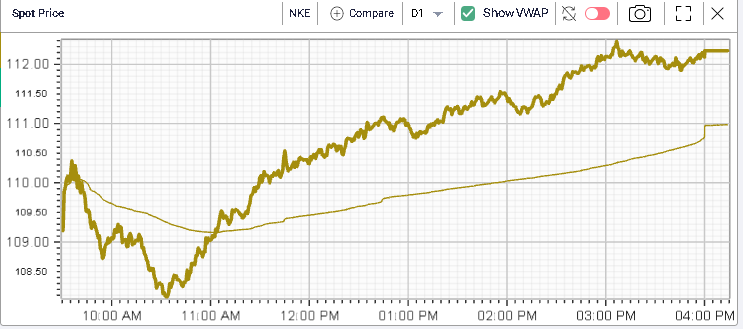
- NKE gaining 4.05%. The stock is still 31.85% lower on the year.
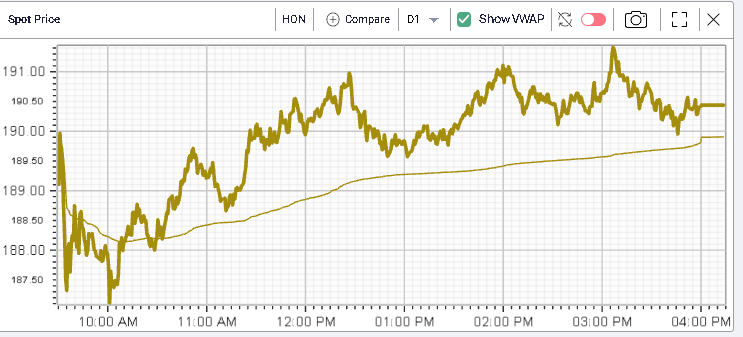
- HON gaining 3.69% with a YTD performance of -7.91%.
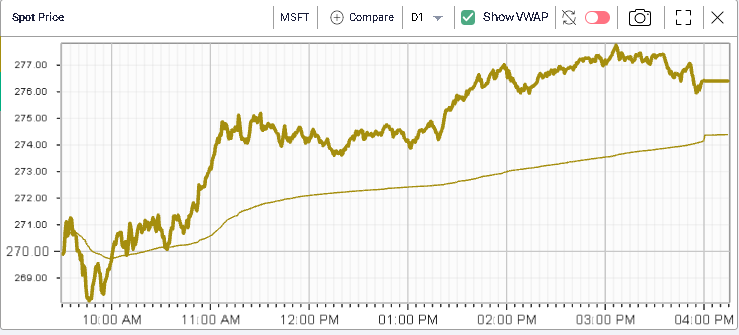
- MSFT gaining 2.85% with a YTD performance of -17.43%.
On the downside, the bottom 3 names were:
- TRV dropping 2% which is unchanged on the year
- MRK -1.41% and +17% YTD
- INTC losing 1.17% and settling 25.4% lower on the year.
After the close, INTC reported some weak revenues and earnings that saw the stock trade 10% lower in the after-hours session. Definitely a stock to watch today.
Implied volatility kept on moving lower as shown on the below 30d IVX chart.
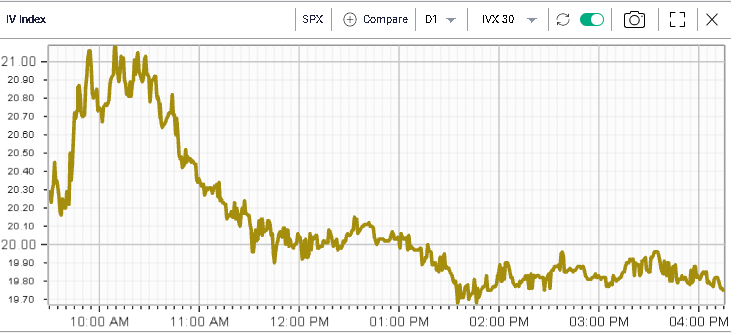
For the SPX, we settled below 20% in the 30 days bucket, a first since mid-April.
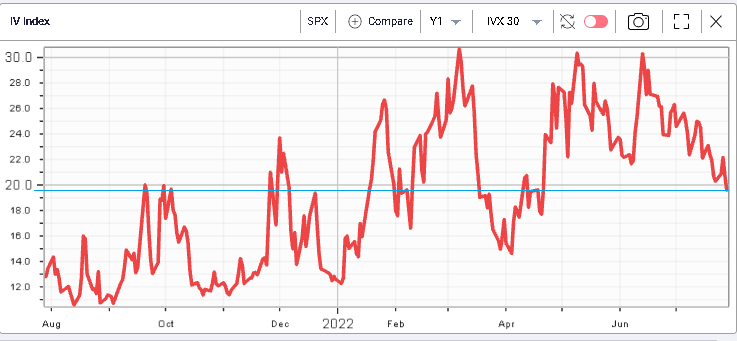
Back on the 21st April (last time the SPX settled below 20%), the index was trading around 4400 or about 321 points higher than where we closed yesterday.
Looking at the term structure between those two dates, it is interesting that in the short run, the market is feeling much more confident now about the possibility that little happens. This could be linked to the summer effect that we discussed in a previous market update where we studied a potential large strangle seller with expiration at the end of August.
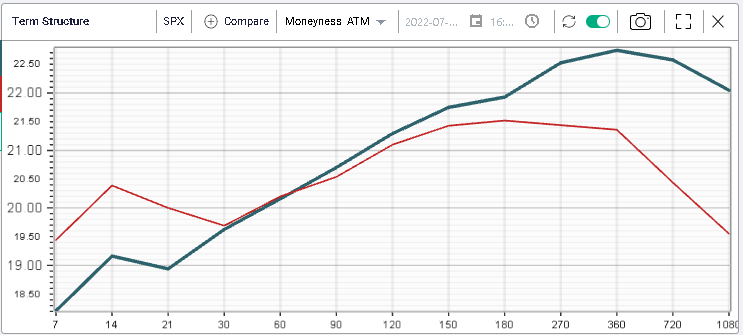
In comparison to April’s term structure, we can see that the market is now expecting a higher volatility in the coming months, quite possibly reflecting the worries about the dichotomy that the FED will have to manage, on the one hand the need to raise rates to stem inflation and on the other hand, the need to become more accommodative at some date in the future to help the economy handle the slowdown they will have created to achieve their inflation goal.
The amount of uncertainty in the medium term remains very elevated and that is reflected in the implied volatility curves.
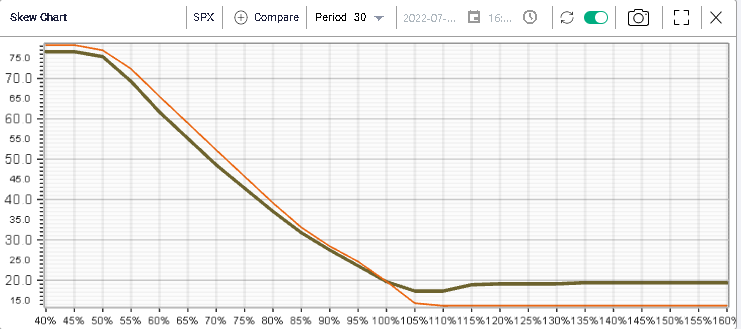
Looking at skew, it seems that market makers are now more comfortable selling puts than they were back in April, or at least, the compensation they require has shrunk, in particular for very downside options. On the upside though, it seems that the market makers are now unwilling to offer calls as aggressively as they did back then.
Flows in SPX calls have increased over the past few sessions and are now at their highest level in 12 months.
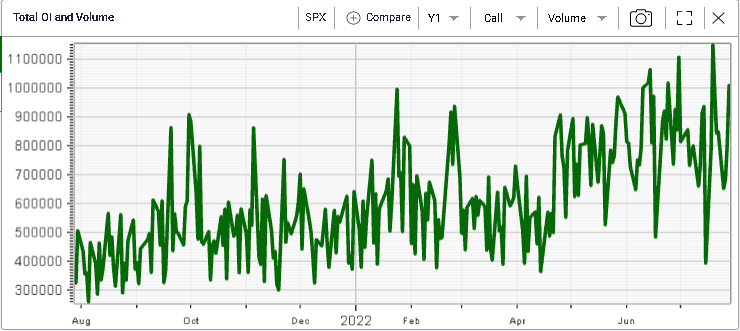
While puts volumes have increased, they seem to be lagging relative to calls in the current environment.
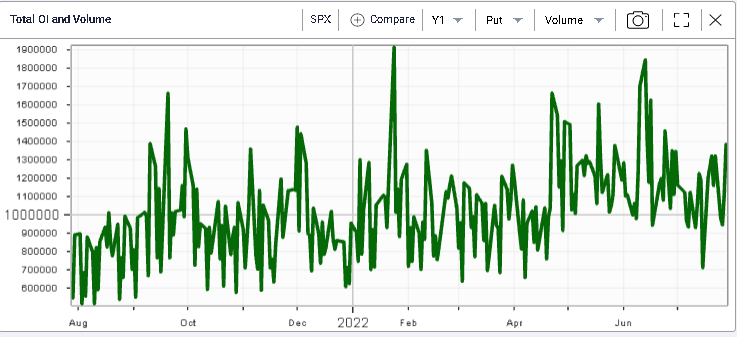
Considering the large breakout from the key downtrend channel (more on this next Monday) that we saw this week, it is entirely possible that some market participants are trying to increase their exposures by buying call options. As volatility has dropped significantly, the cost of buying such options has been reduced and may have prompted the increase in volumes witnessed.