SPX breaks out, call volumes increase, is the bull market back?
August 1, 2022
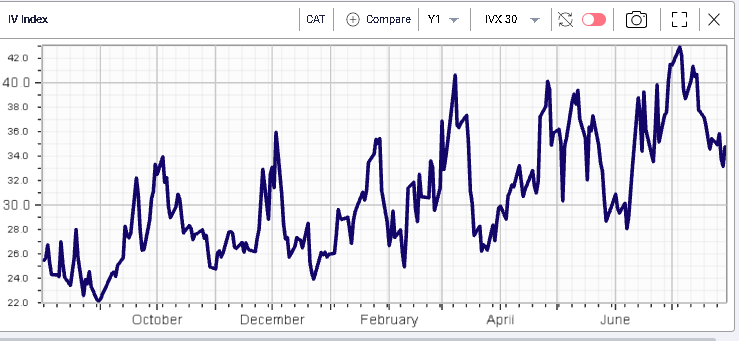
Clean breakout last week with the SPX gaining 4.26%, the NDX +4.45% and the DJIA + 2.96%. Implied volatilities were under pressure over the course of the week. 30d IVX for the SPX settled 1.73% lower, the NDX 30d IVX lost 1.87% and the DJIA lost 1.82%.
Looking at the SPX, the break is evident with both the trendline from 2022 breaking as well as the more recent variant that started in April.
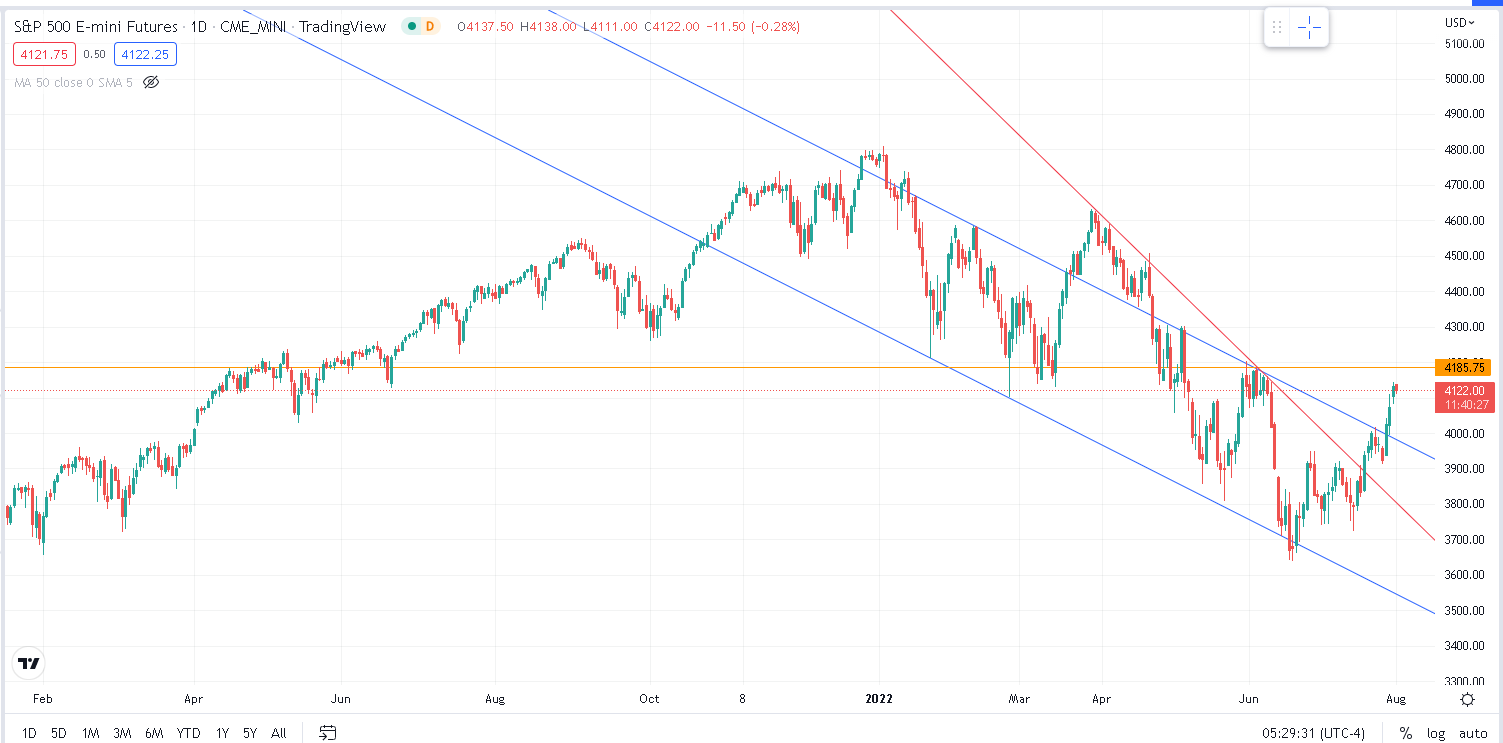
The first major hurdle for bulls is seen in the 4185-4200 zone. That area represents the closest local high reached by the market in the 5-wave selloff that started at the beginning of the year and finished in June 2022. If bulls manage to take over that area, the confidence boost will be very large.
In the beginning of June, the fight between bulls and bears was intense and was followed by a very large selloff that resembled a capitulation move by bulls that pretty much lasted until the June expiration. This zone will probably be highly disputed once again so it will be interesting to keep an eye on it.
Should we manage to break on the upside, it would also open up significant upside with the next major local high seen around in the 4575-4600 region.
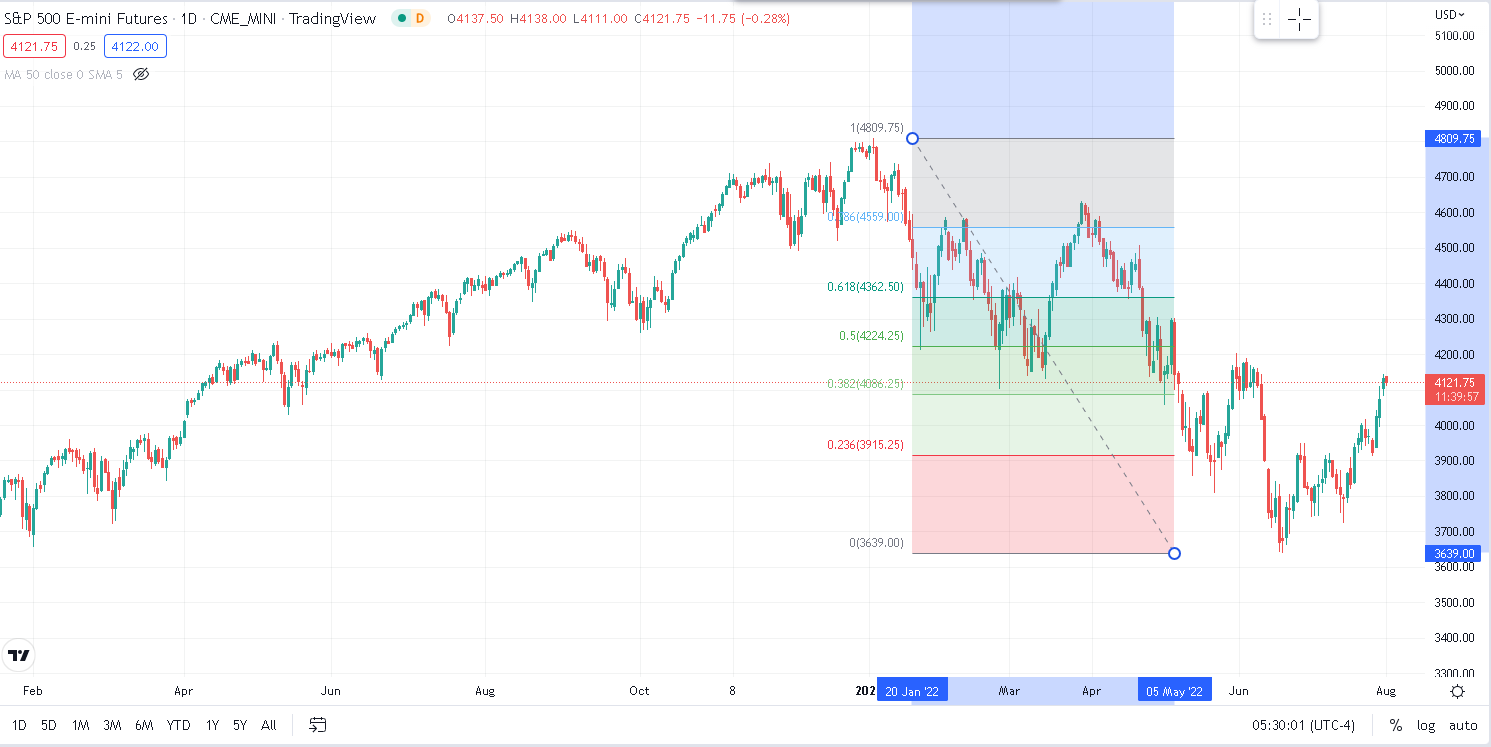
Looking at Fibonacci retracements of the 2022 selloff, the 50% retracement is seen around 4230, the 61.8% at 4370 and the 78.6% seen around 4570.
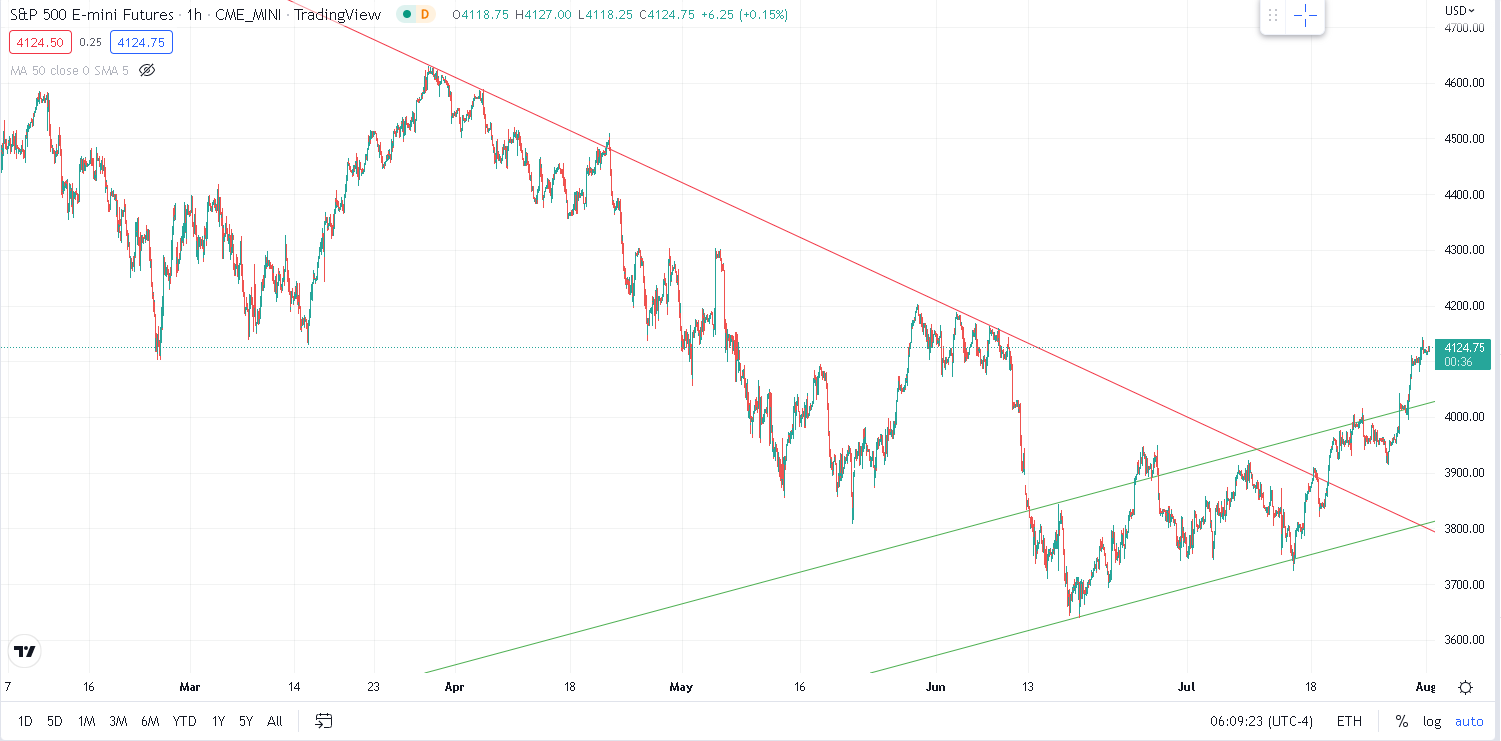
Looking at the hourly chart since early April, we can see the breakout in more details. We can also see that the pace at which the market is moving higher accelerated over the past few weeks breaking out as well of the green up-trend that had been in place since the June expiration date.
We saw during the week that flows started to pick up for the SPX, particularly on the call side which is always interesting during a powerful move higher in spot.
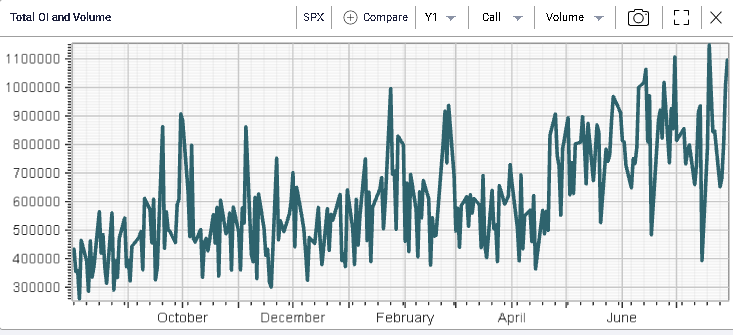
Looking at flows in greater details, we see a focus on very short dated put with expiration date this week. For instance, we saw:
- 41k of the 8th Aug’22 3750 puts
- 39.6k of the 8th Aug’22 3900 puts
- 38.6k of the 5th Aug’22 3700 puts
- 37.9k of the 5th Aug’22 3850 Puts
The most traded options over the week were the Sep’22 3500 puts which were exchanged 41.6k times. For the regular expirations we also saw, 34.75k of the 4000 puts with expiration Sep’22 and 29.6k of the Sep’22 4000 calls.
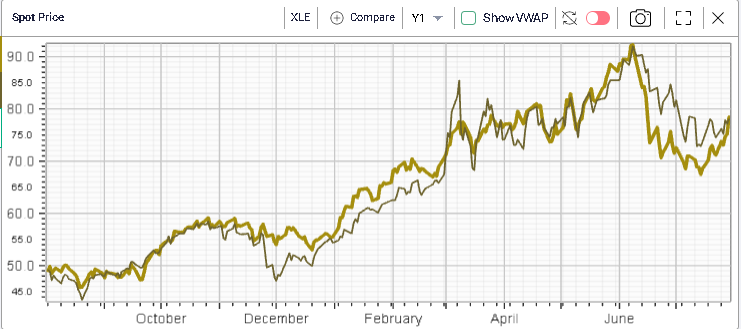
Looking at sectors over the week, the energy space performed well gaining over 10%. With that rally, the gap that we highlighted on multiple occasions in our market updates, between equities and USO has now closed as shown on the below chart.
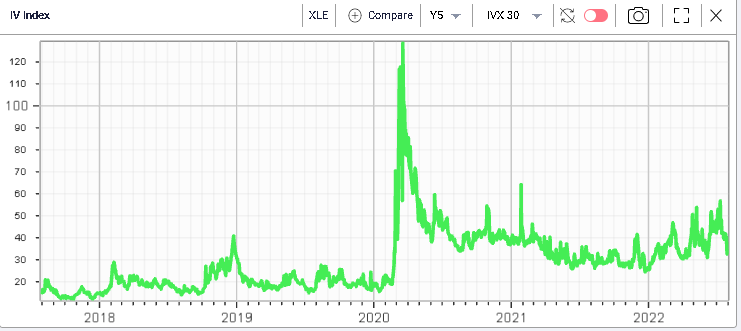
Implied volatility for the energy stocks also dropped meaningfully over the week, shedding about 7% over the week for the 30d IVX shown below.
Utilities also performed well on the week gaining more than 6% and trailed slightly by Technology stocks +5%, Consumer Discretionary +5% and Industrials +5.75%.
Laggards included Communication names which gained less than 1% over the week and Consumer staples gained slightly less than 2%.
A lot of the activity remained driven by single stock stories rather than sectorial plays. We note the following upside moves over last week:
- CVX gained almost 15% and is back to +37% on the year.
- CAT gained slightly more than 10% and is at -4% on the year.
- MSFT gained 7.5% over the week and is at -16% on the year.
On the downside we saw:
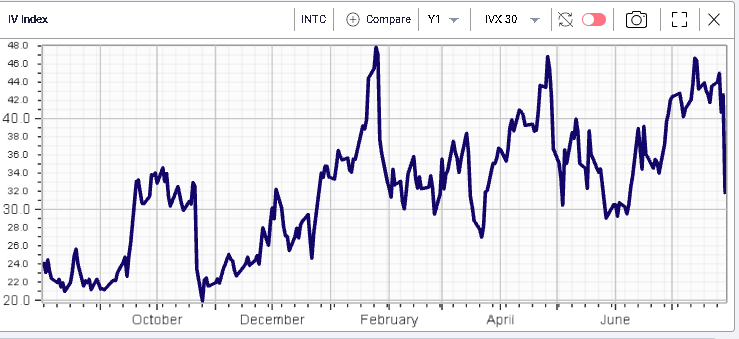
- INTC lost 7.3% over the week and is at -32% on the year
- PG lost around 2.5% over the week and is at -15% on the year
- HD dropped 2% over the week and is at -26% over the year.
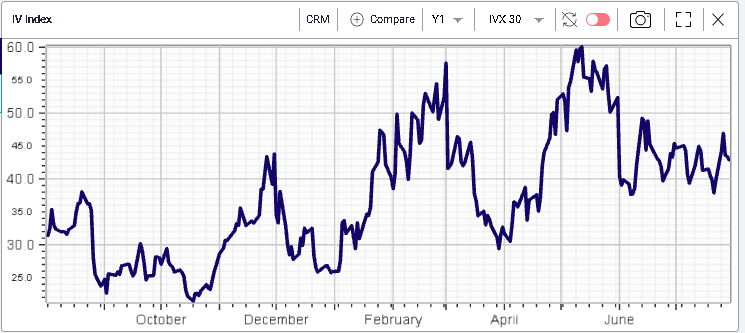
Implied volatilities moved lower over the week in pretty much all of the DJIA components. The only notable exception was for CRM which gained more than 3% for the 30d IVX over the week.
The biggest implied volatility crush was seen in INTC with 30d IVX moving 12% to the downside.
Two other worthy mentions include V. The stock lost around 1% over the week and the 30d IVX remarking 8% lower. Finally in CAT which as we saw before had a really good week, we saw implied volatility remain elevated losing less than 1% over the week.