The fight has started
August 2, 2022
Early in the session, bulls tried to push prices through the key 4150-4200 area but bears responded quickly as soon as prices entered the previous local high territory. We discussed in yesterday’s market update why this zone (which at its core is set between 4170 and 4200) matters a lot for both sides.
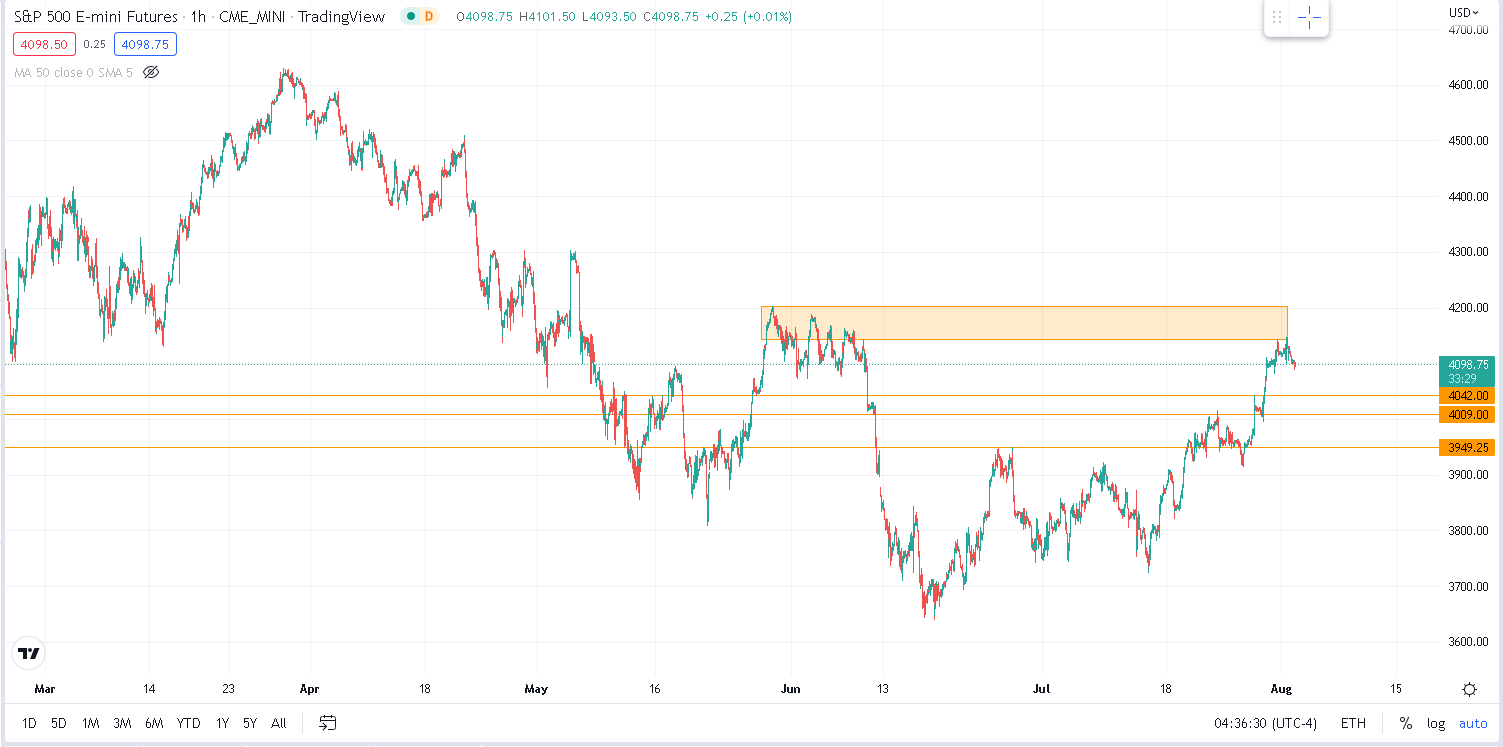
Source: Tradingview.com
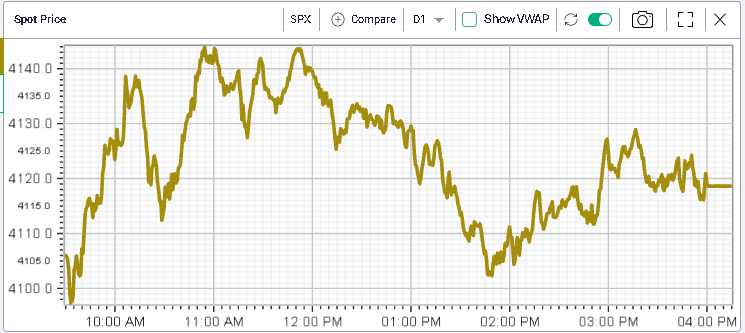
The fact that bears mobilized so quickly may have spooked some bulls and triggered a retest of the 4100 support before prices settled in the middle, at 4118.63, down 0.28% over the day.
The NDX finished pretty much unchanged on the day and the DJIA closed 0.14% lower.
Looking at the term structure of the SPX, it is interesting to note that short dated options are now much lower in volatility terms than mid term options. For instance, weekly options are now priced with an implied volatility of around 18.5% while 90 days options have an IV above 21%.
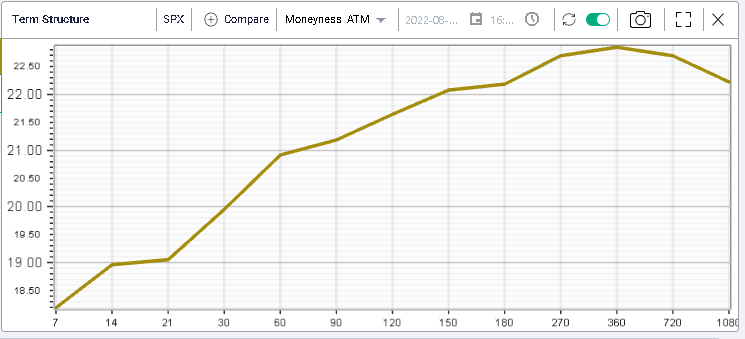
Historically, the difference between the 7 days IV and the 90 days IV ranges between -10% and +50% (or +10% outside of extreme moves).
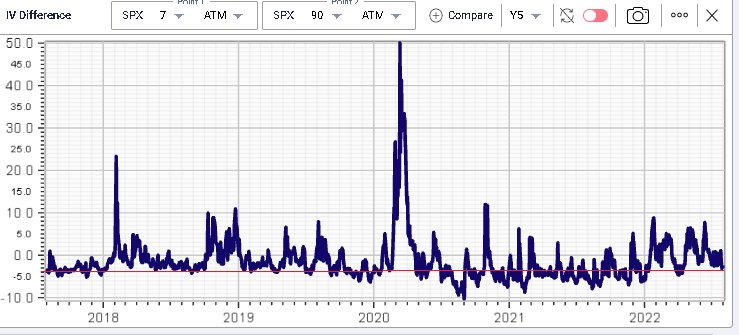
The current reading of around -3% is slightly lower than historical average but not yet at extreme levels indicating that there is a possibility of a further correction lower in short dated volatility should spot prices slow down as bulls and bears square off around the 4150-4200 area.
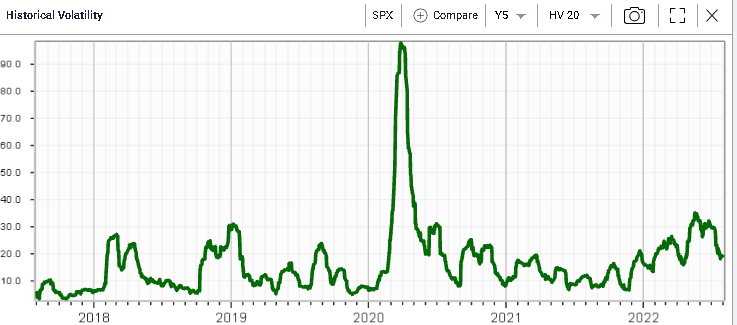
In fact, looking at 20 days realized volatility, we can see that it has corrected from the mid-30s to sub 20% in a few weeks. As IV remained fairly elevated on the recent leg higher in spot, this has probably contributed slightly to supporting implied volatilities and as a result, a meaningful slowdown could give volatility bears some confidence to get short, at least in the short term and until the summer holidays are over.
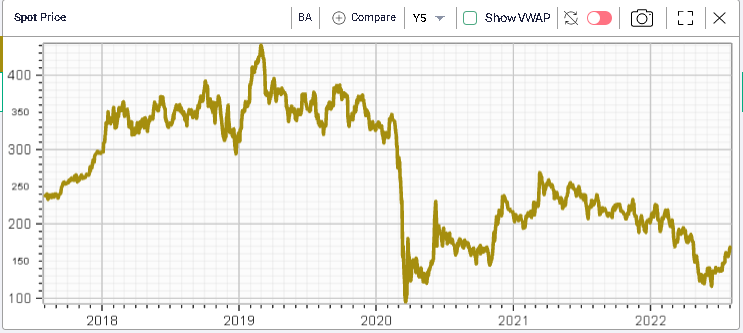
Looking at stocks, we note that BA had a fairly solid session yesterday gaining slightly more than 6%. Media reports indicated that the company had received clearance from the FAA to restart the 787 Dreamliner deliveries which may have given a confidence boost in the name.
The stock has now rallied 46% from its low point in 2022 and is now "only" 18.5% lower this year. This being said, looking at the chart below, we can see that the value destruction since 2020 remains very large with a stock trading around $170 at present times compared with more than $300 just before the pandemic.
PG was also fairly strong gaining 2.9% on the day. The stock had dropped last week after the company released earnings. On the flip side, CAT and CVX which were amongst last week’s best performers both had a fairly heavy session, CAT dropped 1.8% and CVX lost 2.1%.
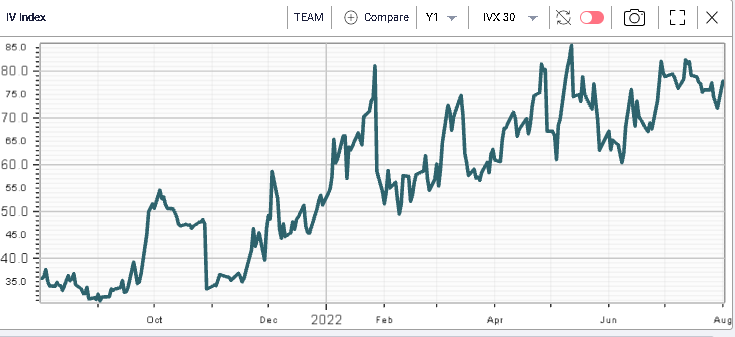
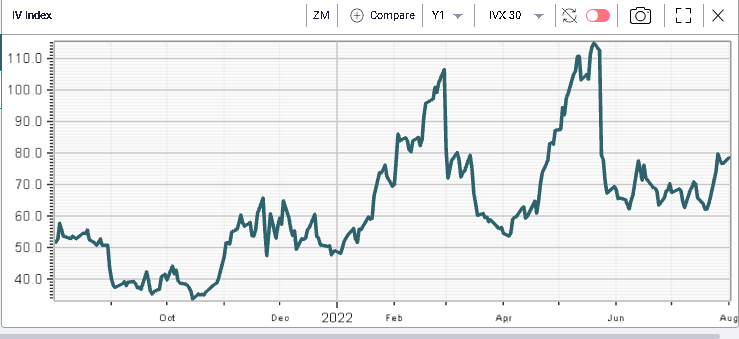
Implied volatility has been drifting higher for quite a few names recently, despite the general trend of vol compression. Those include ZM which is expected to report earnings at the end of the month and where, as shown below, 30d IVX has been creeping higher over the past few days.
We can also flag TEAM where 30d IVX is now pretty much at 12 months highs as shown below. The company is due to report on the 4th Aug’22.