Defense stocks on the rise
August 3, 2022
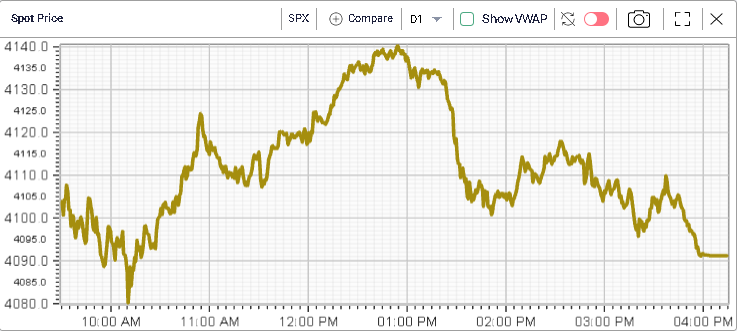
For the second day in a row, bulls tried to attack the 4140 level but like the day before, they faced stiff resistance that sent prices back towards 4110. The SPX settled around 0.7% lower on the day. The NDX dropped 0.3% and the DJIA lost 1.23%.
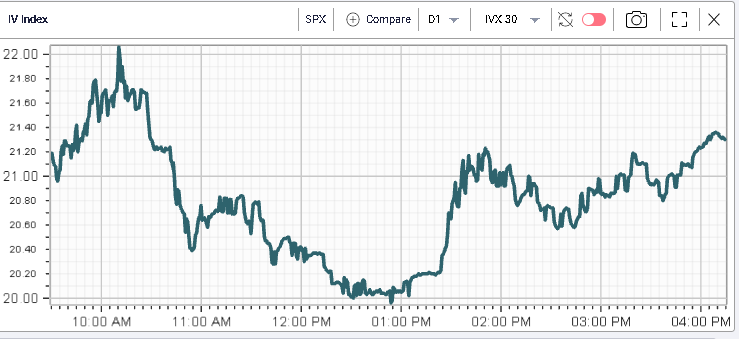
Implied volatilities were pretty stable over the day with 30d IVX closing pretty much unchanged on the day as shown on the below 1-minute snapshot chart.
All sectors finished the day in the red with Financials dropping 1.11% (worst performers), Industrials dropping 1.05% and Materials losing 1.02%. Utilities, Energy and Communications offered the best performance losing around 0.2% only each.
Within the DJIA components, CAT was the biggest laggard, dropping almost 6% on the day and BA struggled as well with a drop of 3.5%. Both stocks had solid performances from their bottom and it will be interesting to see if the market is now rotating towards other names or if this was just a one-day event.
INTC also underperformed over the session dropping slightly more than 2.5%. The stock continues to slide following last week’s earnings report.
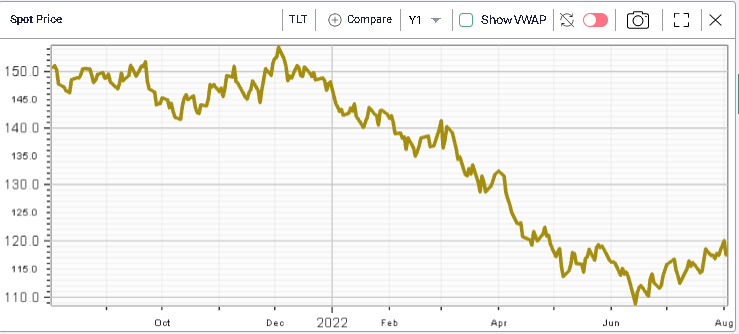
The rally since the June expiration has been partly technical but also driven by a sense that peak hawkishness for the FED may have been reached around mid-June. On the 14th Jun’22 the 10-year US yield was at 3.4%, it is now at 2.78%. This is also visible for the TLT ETF which is a basket of bonds with a target duration above 20 years.
Keeping an eye on rates will thus be crucial for equity traders in the coming months as the FED remains the key driver for stocks and bonds in the current environment.
Geopolitics obviously remain at the forefront of trader’s concerns. The visit of House Speaker Nancy Pelosi in Taiwan has increased the tensions around the island and the military activity from China seems to be on the rise.
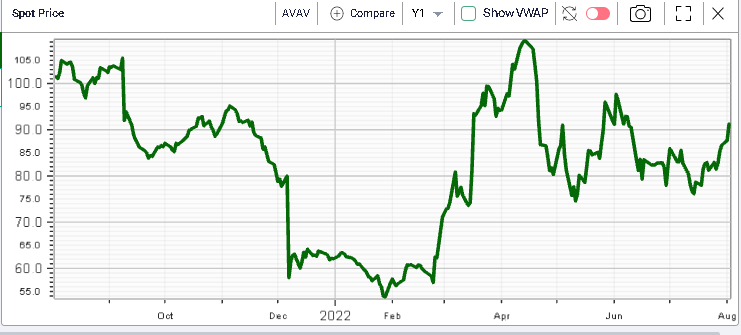
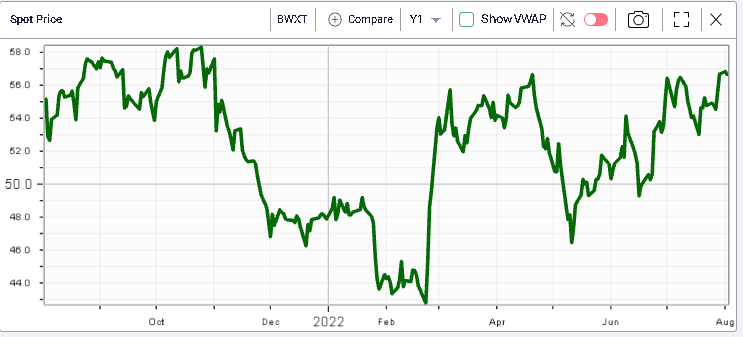
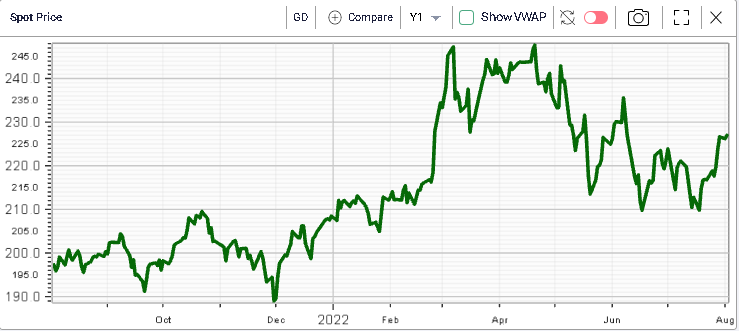
With the rise of tensions, some defense stocks have started to move higher over the past few sessions, for instance (shown below), LMT – AVAV – BWXT and GD.