Taking stock of volatility moves

August 4, 2022

Bulls finally managed to break the 4140 level and rapidly moved prices to the core of the resistance zone between 4170 and 4200 as shown below.

ivolatility spot price chart

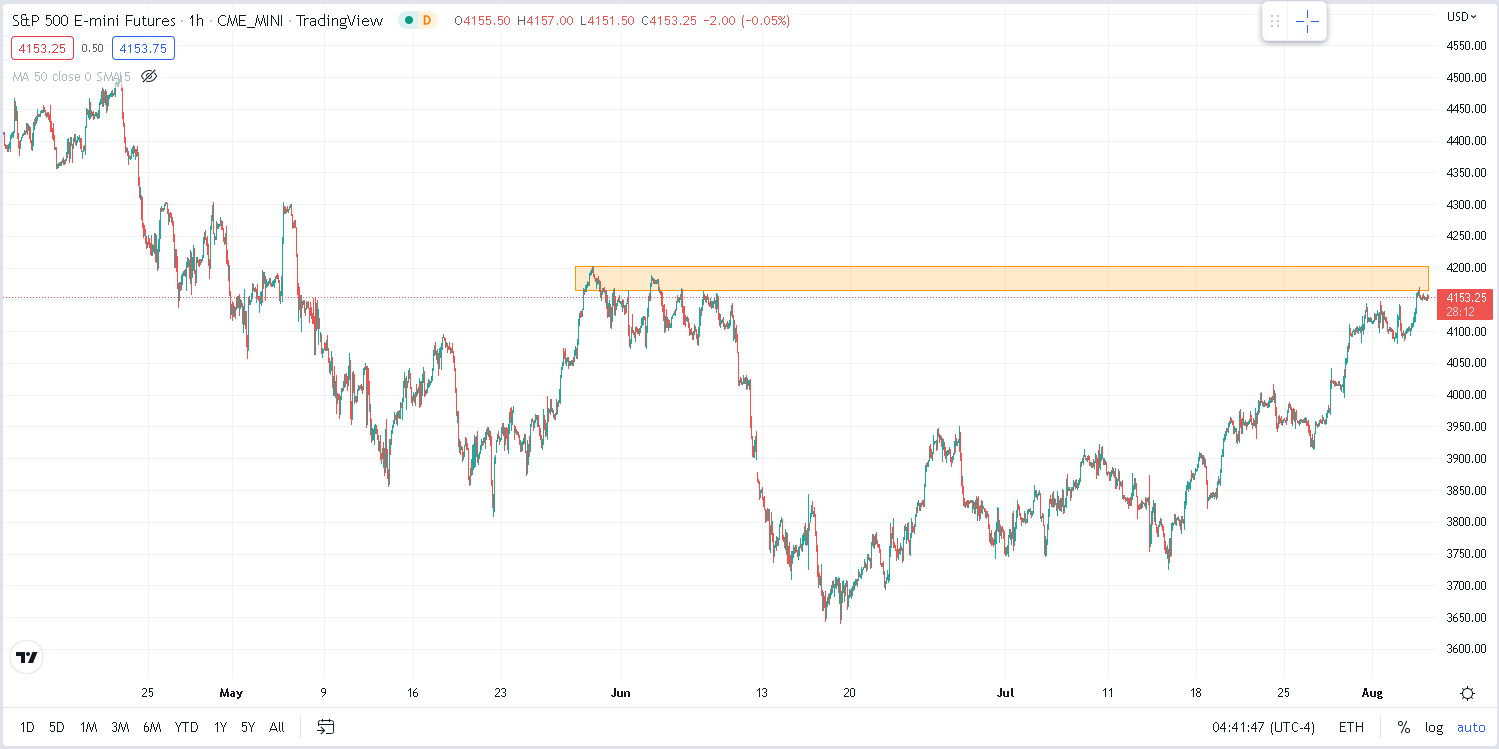
Source: Tradingview.com

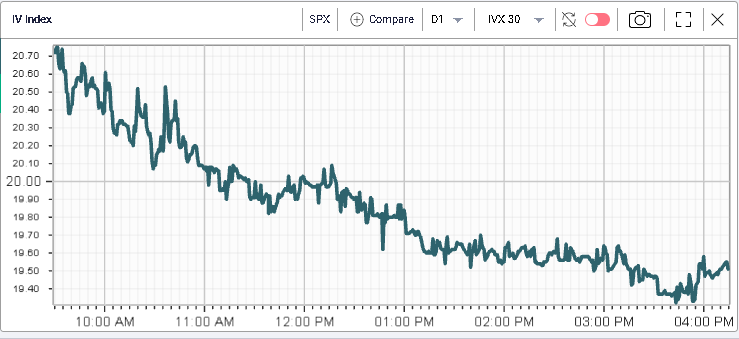
The SPX closed at 4155 (+1.56%), the NDX at 13253 (+2.73%) and the DJIA at 32812 (+1.29%). Implied volatilities drifted lower over the session with 30d IVX for the SPX moving about 1% lower.

Ivolatility spot price chart

Looking at the change in term structure since the July expiration, we can see that the market has mostly repriced short dated volatilities lower with the 2 weeks IV losing around 4 points and the 30d IV dropping 2.5 points.

Ivolatility spot price chart

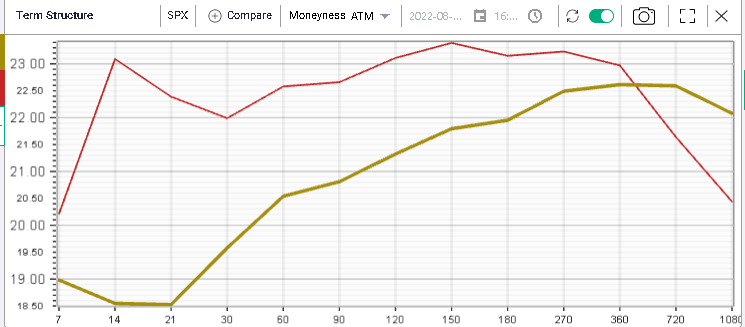
For the NDX which started from a much higher base, 14d moved 5 points lower but remains around 25%. Longer term volatilities have remarked even less than for the SPX, for instance 30d IV is around 2 points lower for the NDX.

Ivolatility spot price chart

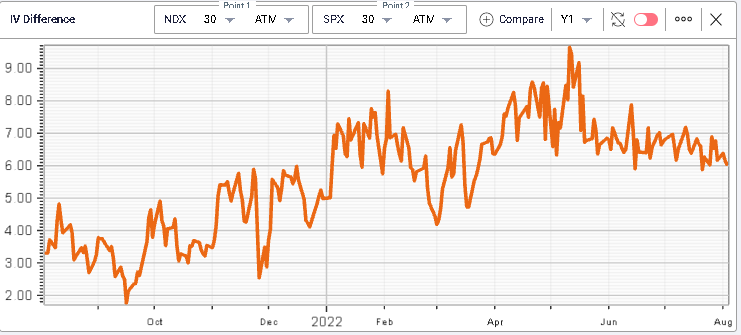
Looking at the NDX/SPX IV Difference chart, we can see that the spread has remained fairly stable around 6 vols.

Ivolatility spot price chart

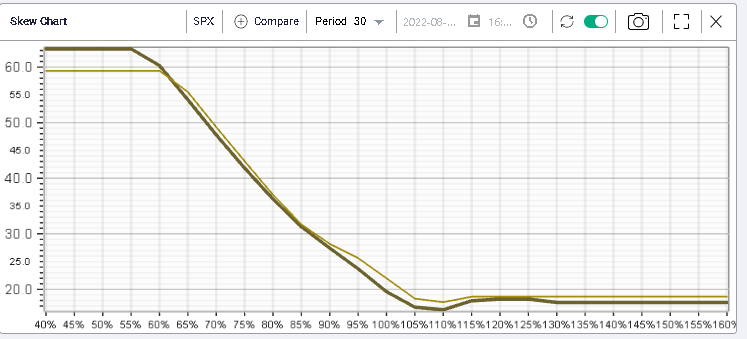
Looking at skew, the dark bold line is as of yesterday while the yellow line is as of the July expiration date. We can see that downside puts have seen their implied volatilities move slightly lower since then while options around the money have been sold more aggressively.

Ivolatility spot price chart
Disclaimer - This information is provided for general information and marketing purposes only. The content of the presentation does not constitute investment advice or a recommendation. IVolatility.com and its partners do not guarantee that this information is error free. The data shown in this presentation are not necessarily real time data. IVolatility.com and its partners will not be liable for any loss or damage, including without limitation, any loss of profit, which may arise directly or indirectly from the use or reliance on the information. When trading, you should consider whether you can afford to take the high risk of losing your money. You should not make decisions that are only based on the information provided in this video. Please be aware that information and research based on historical data or performance do not guarantee future performance or results. Past performance is not necessarily indicative of future results, and any person acting on this information does so entirely at their own risk.
Important Cookie Information
We use the minimal necessary cookies to ensure that we give you the best experience on our website. You must accept cookies in order to use our website. Learn more about privacy at IVolatility.
I Accept