Dissecting Coinbase’s move higher
August 5, 2022
Another day of consolidation in the market yesterday with the SPX finishing largely unchanged at 4152. The NDX did slightly better, gaining 0.44% to 13311 and the DJIA dropped 0.26% to 32726.
At the same time as headline indices are very relaxed, a lot seems to be happening under the surface. One stock that has been getting some attention over the past few days has been Coinbase. The stock gained around 10% yesterday to $89. Media reports flagged that the company signed a deal with Blackrock to allow its clients to access crypto.
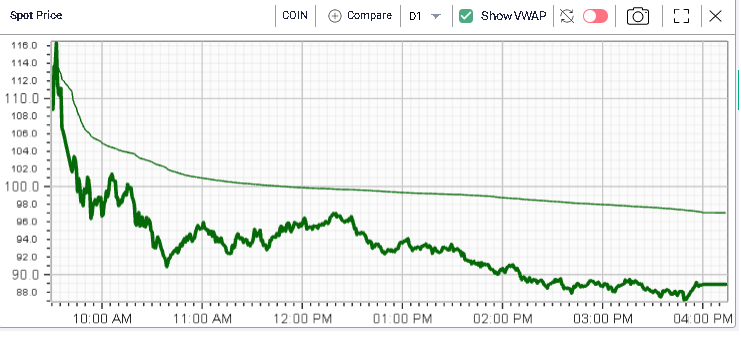
At the beginning of the session, the stock was up around 44% to $116 but drifted throughout the day to finish at $89. In fact, looking at the intraday price action against the VWAP, it looked like some investors seized this opportunity to sell out of longs.
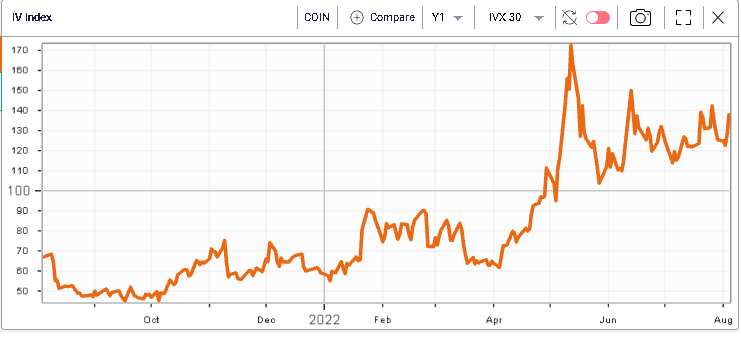
Looking at the implied volatility in the name, it actually went up over the session, despite the move higher in spot. The 30d IVX is now around 140% which is fairly elevated historical, even for COIN.
The changes in term structure are quite telling of the concerns that market makers are currently expressing about the stock. In orange below we show Thursday’s closing values and in blue Wednesday’s.
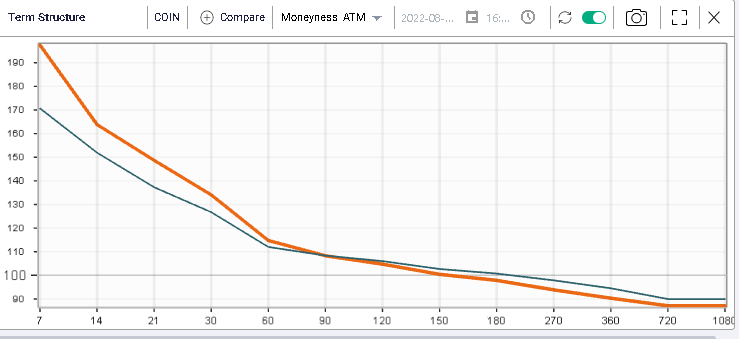
The implied volatility spiked significantly over the short term with weekly options gaining more than 20 points and 30d IVX moving higher by about 7 points. For long dated options, options market makers seemed happy that the news would reduce the amount of uncertainty in the name with 1-year options losing around 5 points over the session.
Analyzing the skew chart provides some useful insight about those concerns expressed by market makers. First, we can see that the entire red curve moved higher from the blue curve (as of Wednesday 3rd close)
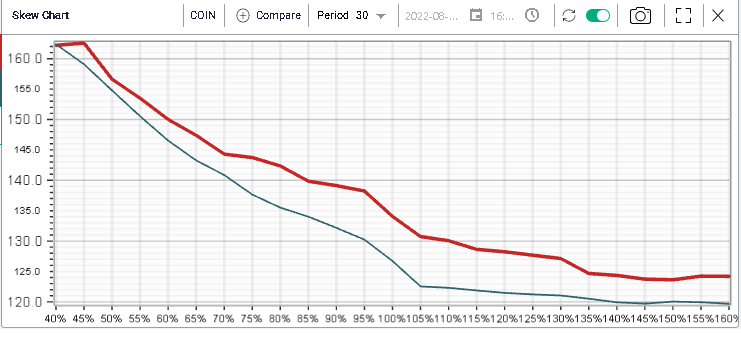
Second, it is interesting that the difference seemed greatest for options close to the money from 90% to 115%. The call side in particular seemed to remark the most.
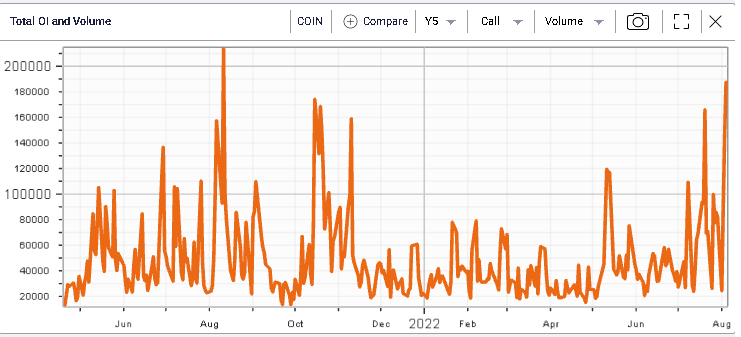
This is interesting because we can see a huge spike in volumes yesterday for calls which reached their highest level since August 2021.
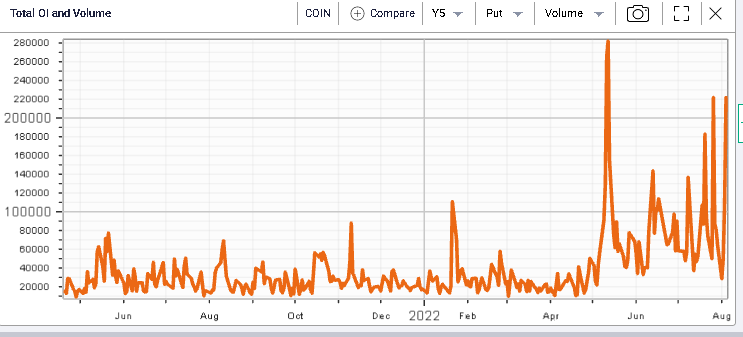
Puts also traded in some significant size with the third highest volume since the IPO
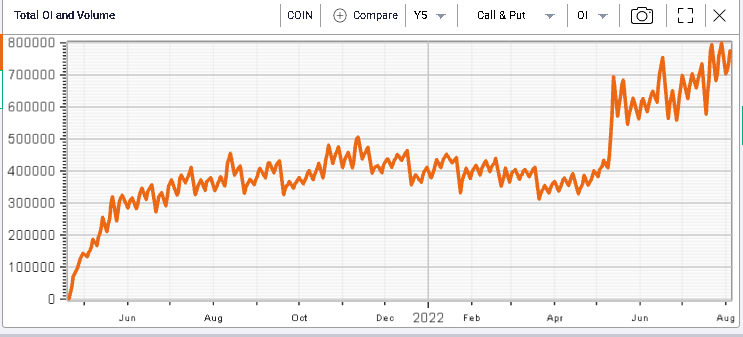
Overall, the buildup in option positions has increased meaningfully over the past few months and the current put and call open interest is pretty much at its highest point since the stock went public.
Using the Ivolatility API (more information on: https://redocly.github.io/redoc/?nocors&url=https://restapi.ivolatility.com/api-docs) we can build a quick scanning system that allows to find the most traded options over the session in order to better understand the kind of views that traders were expressing.
It is also possible to rebuild this analysis in Excel using the download functionality for the COIN option chain directly in IVolLive. If you need more information about the API or IVolLive, feel free to write to us on: support@ivolatility.com
Looking at the most active options over the session, we can immediately see that traders focused on very short dated structures.