Markets consolidate, big levels ahead
August 8, 2022
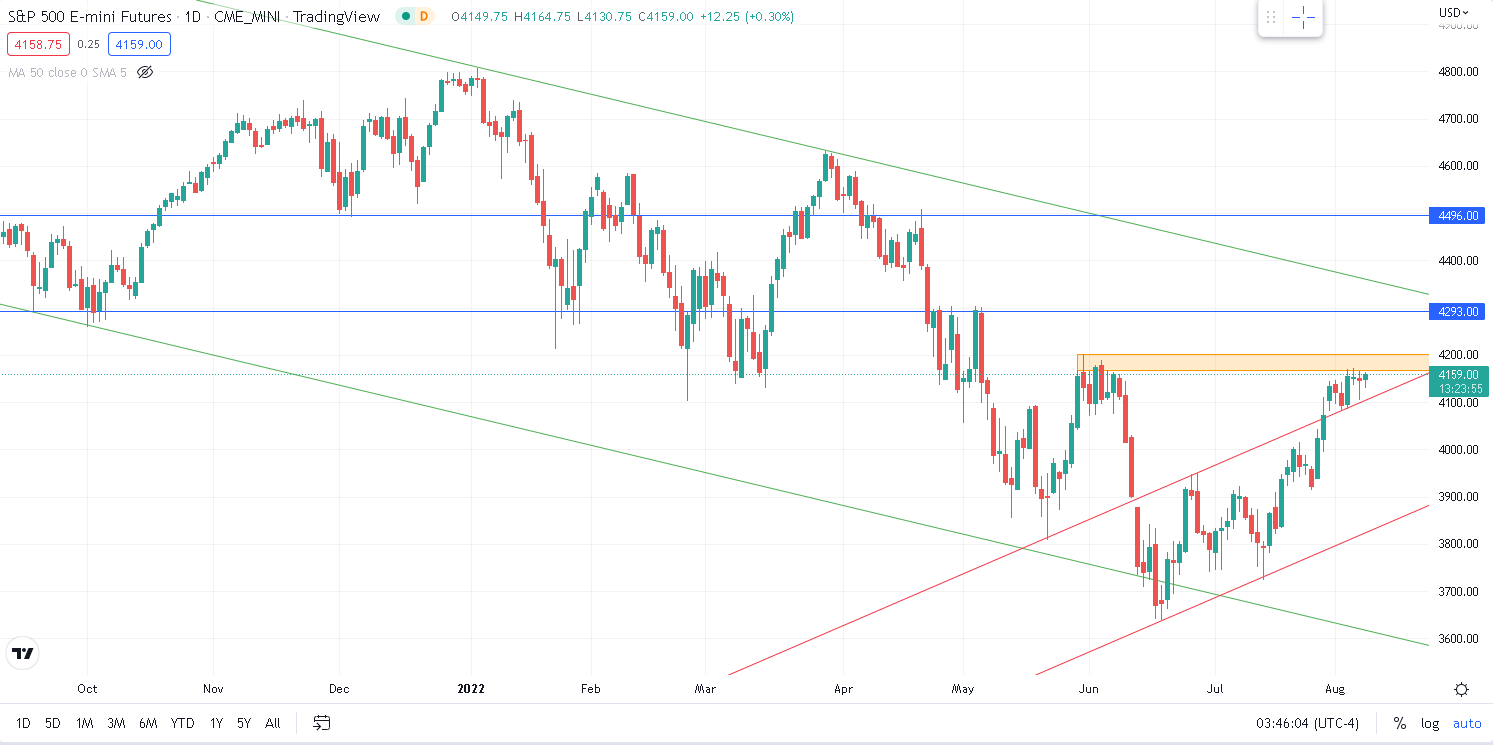
Last week would be best described as a consolidation week for headline indices. In the daily SPX chart displayed below, we can see the two immediate levels that matter most for the market with first, on the upside the zone up to 4200 that marks the first major hurdle for bulls and on the downside, the rapidly ascending support line displayed in red that was actually the upper-end of the trendline established from the bottom made in mid-June.
Source: Tradingview.com
Both levels were tested and respected over the past week and they will most likely continue to attract attention over the coming days.
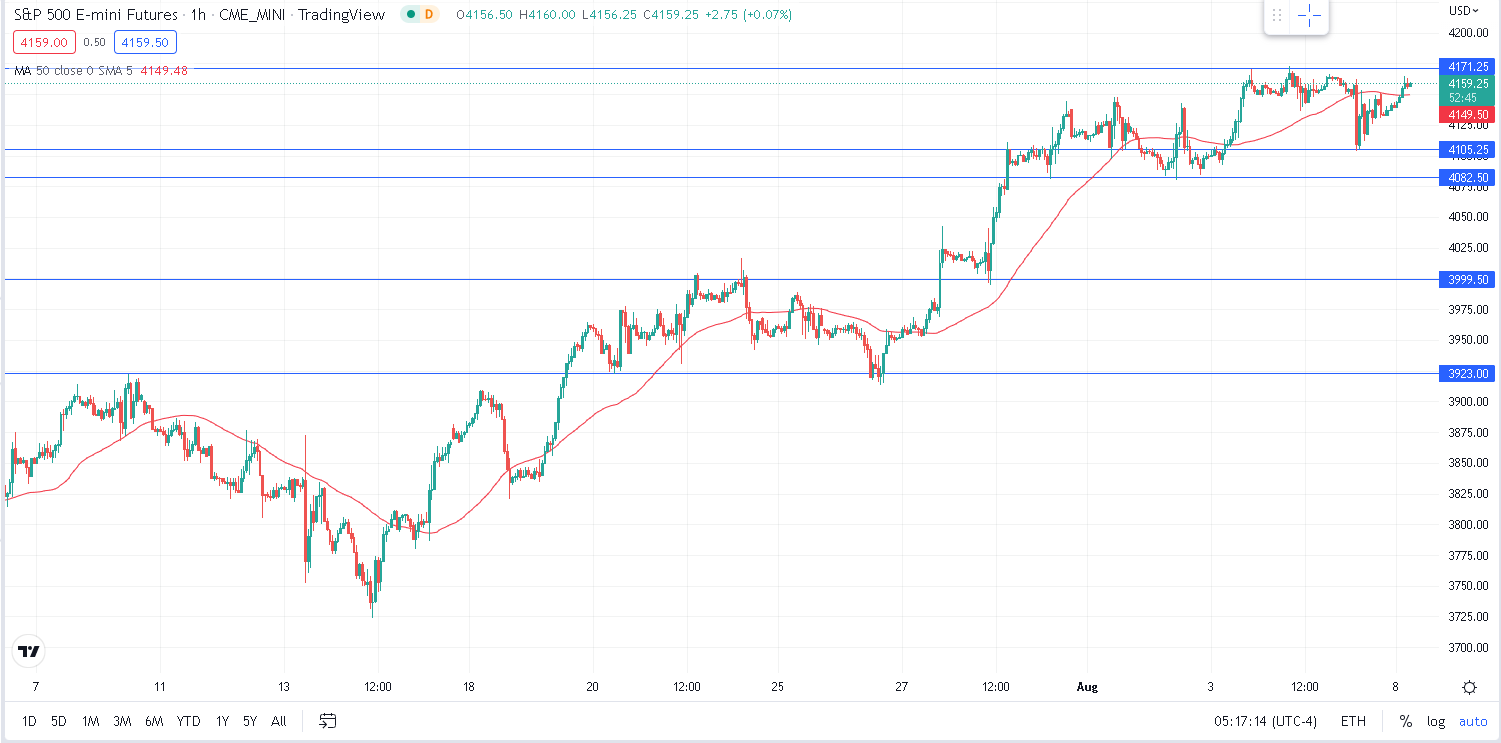
Zooming in on the hourly chart helps us locate some support levels on the downside starting with 4100-4105 which is the area where bulls step into action to defend the SPX when prices were under pressure from bears following the strong jobs report on Friday.
The following levels are seen around 4080 - 4000 - 3923
Source: Tradingview.com
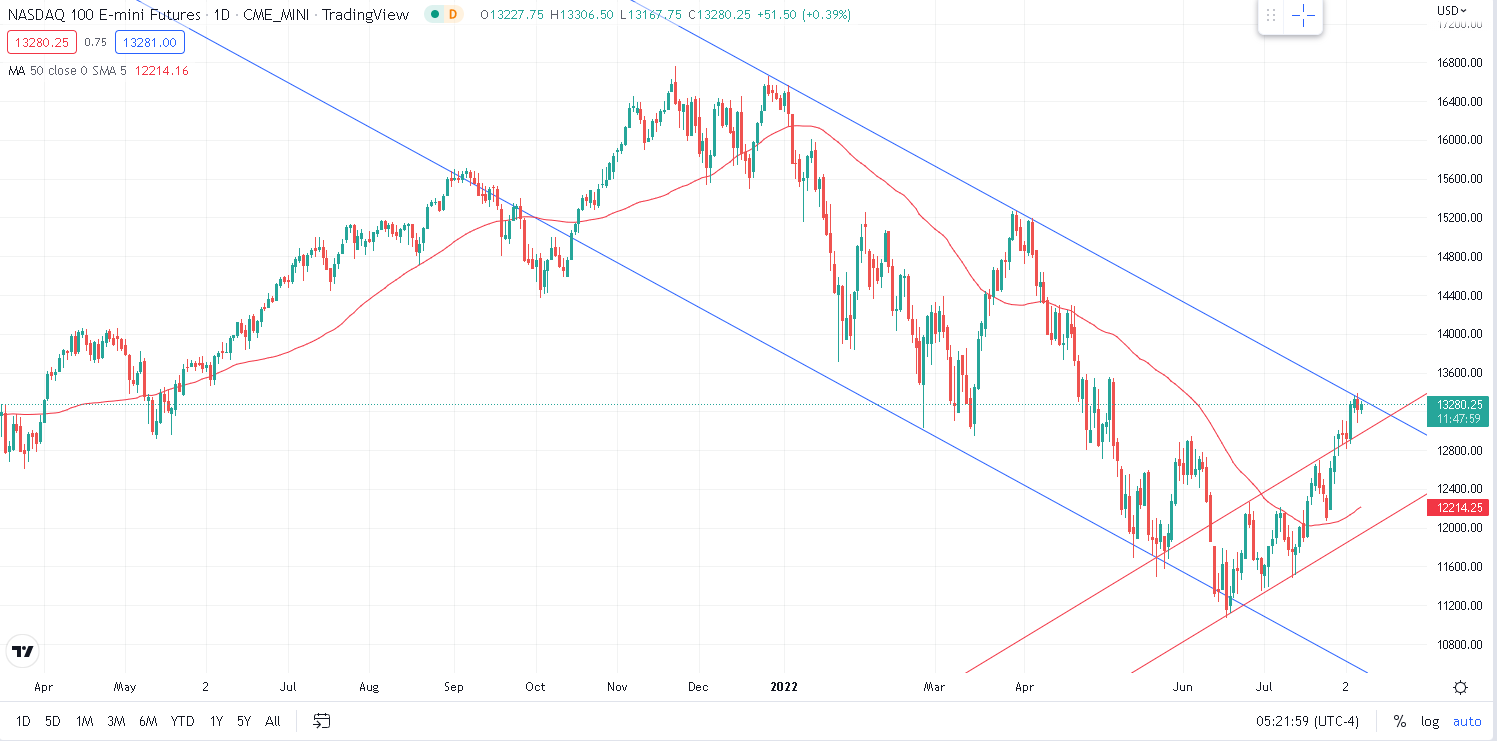
Looking at the NDX, a fairly similar picture emerges. The blue trendline caps the rallies for 2022 so the current level of 13300 plays a significant role for NQ traders. On the downside, the same red channel marking the uptrend from mid-June was broken and now serves as support.
Source: Tradingview.com
Given the configuration of both the SPX and the NDX, it seems that the convergence of the levels identified will force either a break higher or a break lower by the middle of August.
Looking at sectors, the big loser last week was the XLE which dropped more than 7%. The performance was in line with that of the USO which lost around 8.5% over the week.
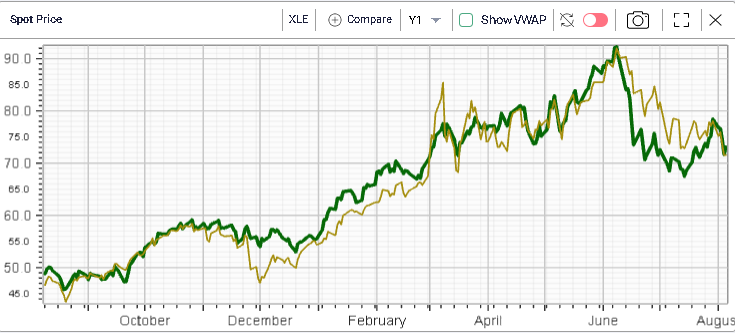
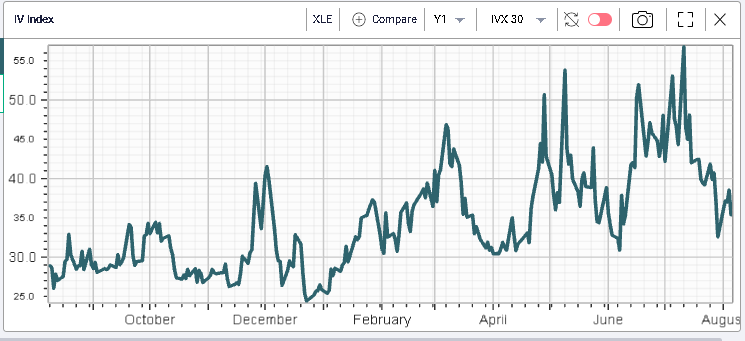
Implied volatility for the XLE remained fairly subdued although it moved higher by around 3 points over the week, it looks low historically.
The rest of the sectors performed fairly close to each other with performances between -2% and +2%. The best performing segment of the market was the Technology space gaining 2% over the week.

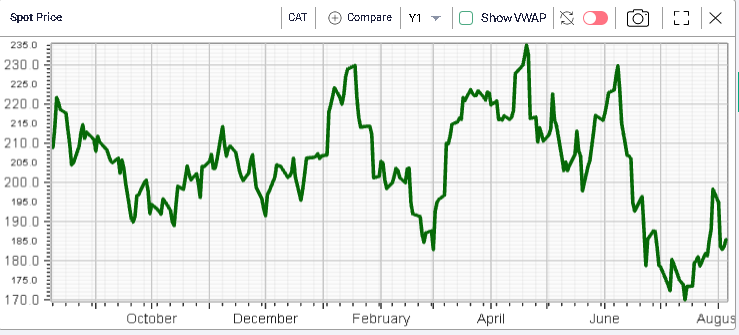
At the single stock level, looking at the DJIA components, CVX and CAT both lost more than 6%, pretty much removing all of their excess performance of the prior week.
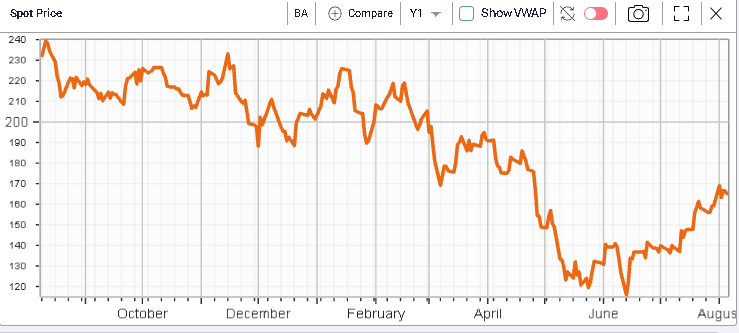
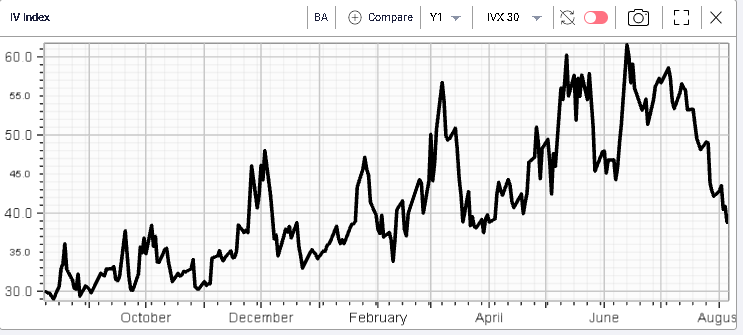
On the upside, BA continued to advance, gaining almost 4% for the week. PG also showed a good performance up slightly more than 4%.
From a volatility perspective, CAT’s implied volatility dropped meaningfully over the week following the company reporting earnings.
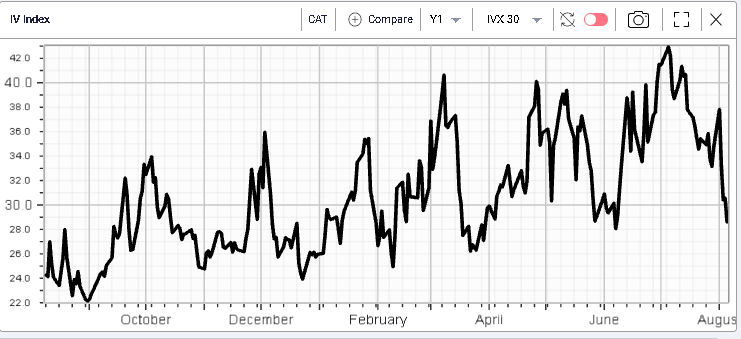
The 30d IVX is now back below 30% for CAT. For BA, the implied volatility also dropped significantly over the week and market makers have now taken a lot of premium out of the implied volatility of BA following its steep rally.
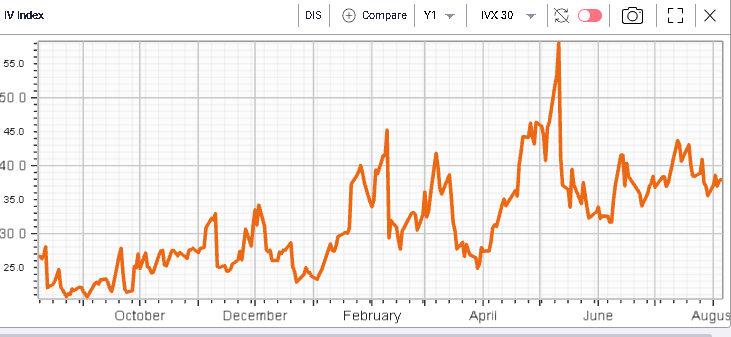
DIS implied volatility was the best performing over the week for DJIA components, gaining around 2 points despite the stock being largely unchanged over the period. As earnings are expected on the 10th Aug’22, market makers moved implied volatility higher although the magnitude looks fairly small on the chart below.