High and low volatilities
August 8, 2022
A further day of consolidation yesterday with the SPX closing at 4140 (-0.12%), the NDX finishing at 13160 (-0.37%) and the DJIA slightly in the green at 32,832.
For a primer on what volatility actually is and how it can be interpreted, please refer to our Youtube channel and in particular to the following video: https://www.youtube.com/watch?v=JWeaaIUGvT0
There are two measures that we typically use here in order to assess this. First, we like to look at the level of implied volatility compared to realized volatility. Put simply, when an options trader tries to understand what volatility to put into his model, he will generally start by looking at realized volatility which is simply the most recent observation of volatility made in the real world.
This is generally not enough and several factors will then contribute to the final number displayed on the IVolLive platform. Is the market maker willing to sell or buy that volatility, how much uncertainty is there for the company, are there many events that could result in significant dislocations in spot.
Market makers will then repeat this process for all the stocks they cover and although that process is fairly rigorous, it is not error-free.
The second approach is to look at the position of the volatility, as set by the market maker, relative to its own history. In IVolLive, we call this measure percentiles as it echoes to the statistical measure returning the historical frequency when volatility was lower than the latest level. For instance, an IVP30 of 98 means that implied volatility for options with 30 days expiration was lower than the current level around 98% of the time over the past 12 months.
In IVolLive, you can easily create a view within Stock Monitor to display both measures at once for a specific set of stocks. Looking at the DJIA we can retrieve the following table:
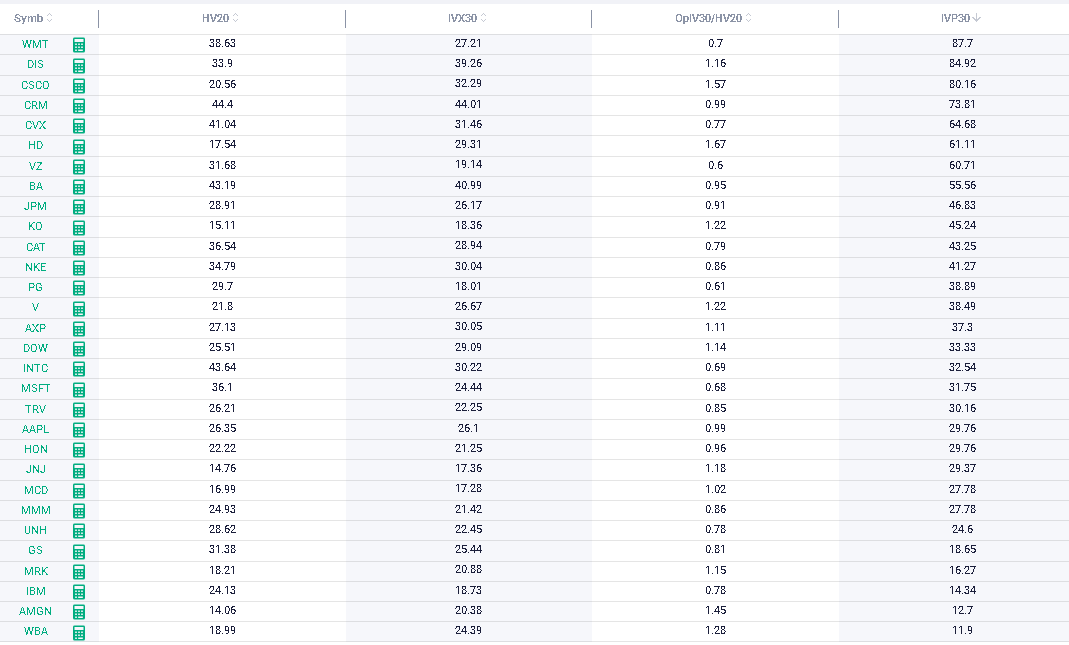
In the above, stocks are sorted by IVP30, with those ranking the highest at the top et those ranking the lowest at the bottom.
The view offers 4 pieces of information:
- IVX30: the 30 days implied volatility index which is a proxy for the expected volatility of options with 30 days to expiration.
- HV20: the volatility obtained by using spot price changes over the past 20 trading session.
- OpIV30/HV20: the ratio of the 30d implied volatility to the 20 days historical volatility.
- IVP30: the percentile of implied volatility for options with 30 days to expiration.
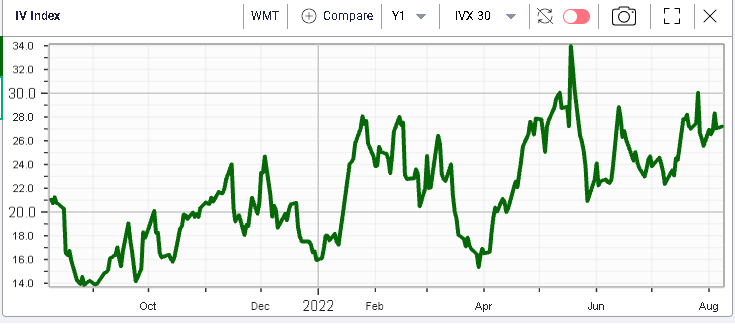
Looking at the list above, we can see that quite frequently we receive conflicting information from both measures. For instance, with WMT, we can see that the ratio of implied volatility to historical is around 0.7, which means that the 30d IVX value is around 70% of the historical volatility value: IVX30 is 27.2% and HV20 is 38.6%.
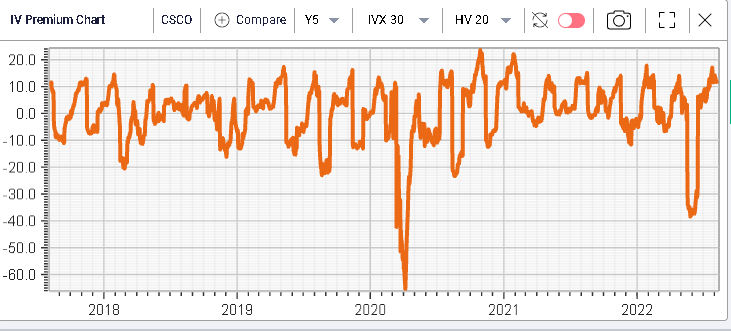
Using IVolLive charts, we can look at the IV Premium chart that shows the difference between implied volatility and realized volatility.
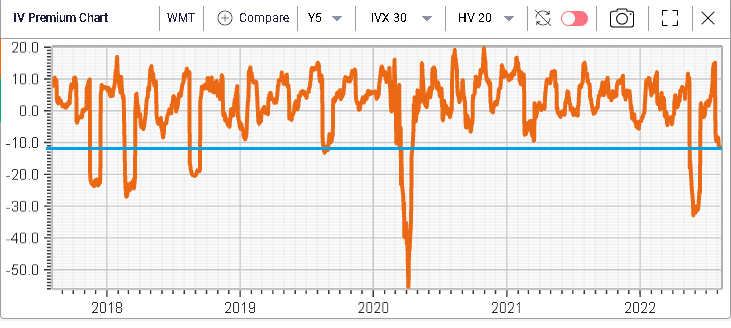
On the above, we can see that over the past 5 years, implied volatility has very rarely traded at a greater discount to realized volatility. This would tend to indicate that implied volatility when measured against realized volatility looks attractive.
On the other hand, looking solely at the implied volatility percentile, it seems that the latest recorded implied volatility is high relative to its own history. In fact, only 12.3% of the time over the past 12 months was implied volatility higher than the current level. Looking at a 1-year historical chart for 30d IVX on WMT, we can see that IV looks indeed elevated historically.
In our table, CSCO looks far more interesting. The implied volatility trades at a 57% premium to historical volatility and the implied volatility itself has only been higher around 20% of the time over the past year. Pulling the same two charts as before, we get:
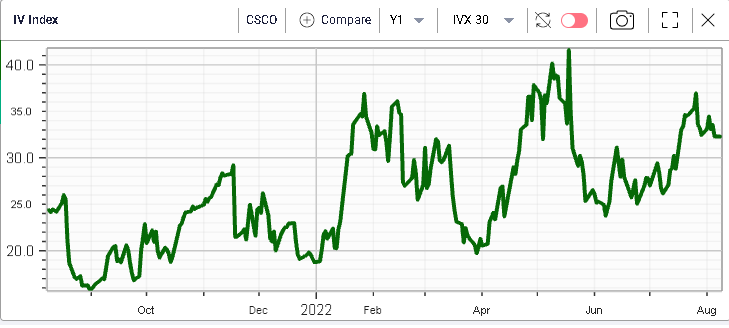
Those measures as they are lining up seem to indicate that market makers are anticipating an increase of volatility for CSCO over the next 30 days. Earnings could be a possible explanation as they are due on the 17th of August. This is where specializing in a handful of stocks really comes handy as it would help the trader to evaluate whether market makers are correct in predicting such an increase of volatility.
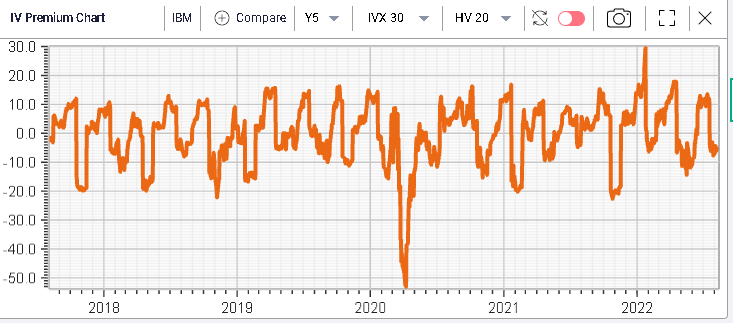
At the bottom of the table, we can spot IBM where we have a ratio of implied volatility over realized that looks low as well as a percentile that looks low historically.
We can see that current 30d IVX is around 18.73% while the latest record historical volatility is around 24.13%. At the same time, 30d IVX 12 months percentile is set at 14.34%.
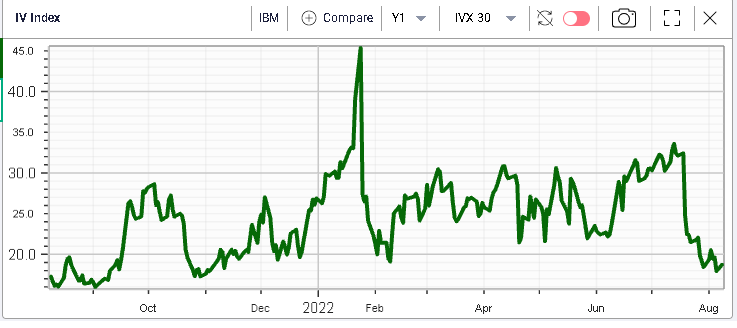
Both measures seem to point to the fact that implied volatility is relatively low historically for IBM. Once again, having a good understanding of the stock will help assess if some catalysts can be identified over the period that might trigger a sudden upward or downward repricing in the stock. The IV Premium and IVX charts for IBM are shown below.