Custom basket to understand stock flows
August 10, 2022
The consolidation continued yesterday with the SPX losing 0.42%, the NDX dropping 1.15% and the DJIA -0.18%.
Within the DJIA components, the tech and consumer discretionary names seemed to struggle with CRM losing almost 4% on the day and NKE down 3.4%. On the upside, TRV outperformed, gaining 1.84% followed by CVX and MCD both up around 1.3% on the day.
Creating a basket made of yesterday’s losers and winners helps us frame those performances in historical context.
Specifically, we have:
Winner Basket = [TRV, CVX, MCD, DOW, MRK] and Loser Basket = [NKE, CRM, INTC, IBM, HD].
Looking at the past 12 months of data (using our RestAPI service), we can build the following historical data chart.

Source: Ivolatility.com / Built with Ivolatility.com REST API
It is interesting to see how the performances of both baskets started to diverge at the start of 2022. Looking at the ratio on the chart below, we can see that yesterday’s move was fairly significant and comes after a correction lower.
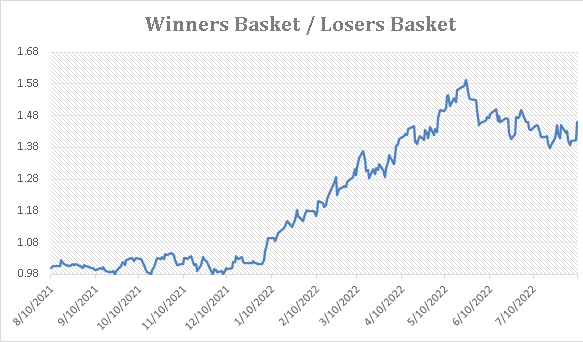
Source: Ivolatility.com / Built with Ivolatility.com REST API
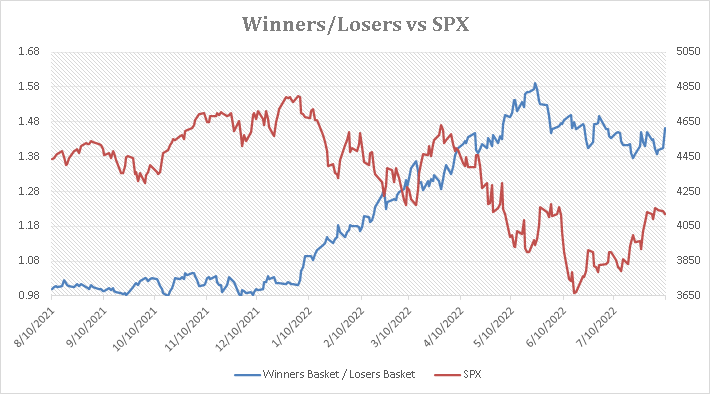
Looking at the ratio compared with the SPX, we can see that the peak in the ratio was reached before the bottom in the SPX. This observation is obviously insufficient to draw any conclusion but we may want to keep an eye on this type of construct when evaluating what is happening in the market, at least under the surface.
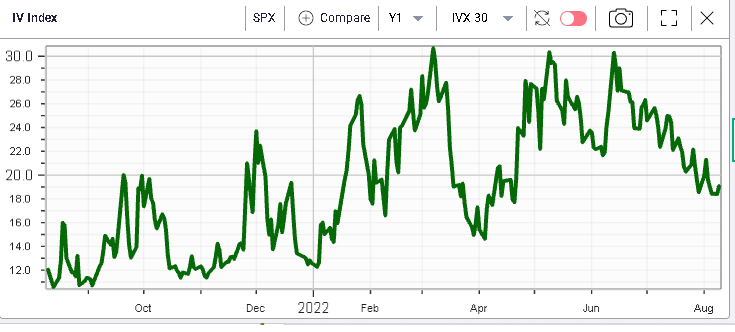
Short-dated options implied volatility rose the most yesterday with 30d IVX gaining around 0.5 points for the SPX.
The SPX 30d IVX remains below 20% for now which is pretty much in the middle of the last 12 month’s range.