A state-of-the-art API for Options, Futures and Stocks
August 11, 2022
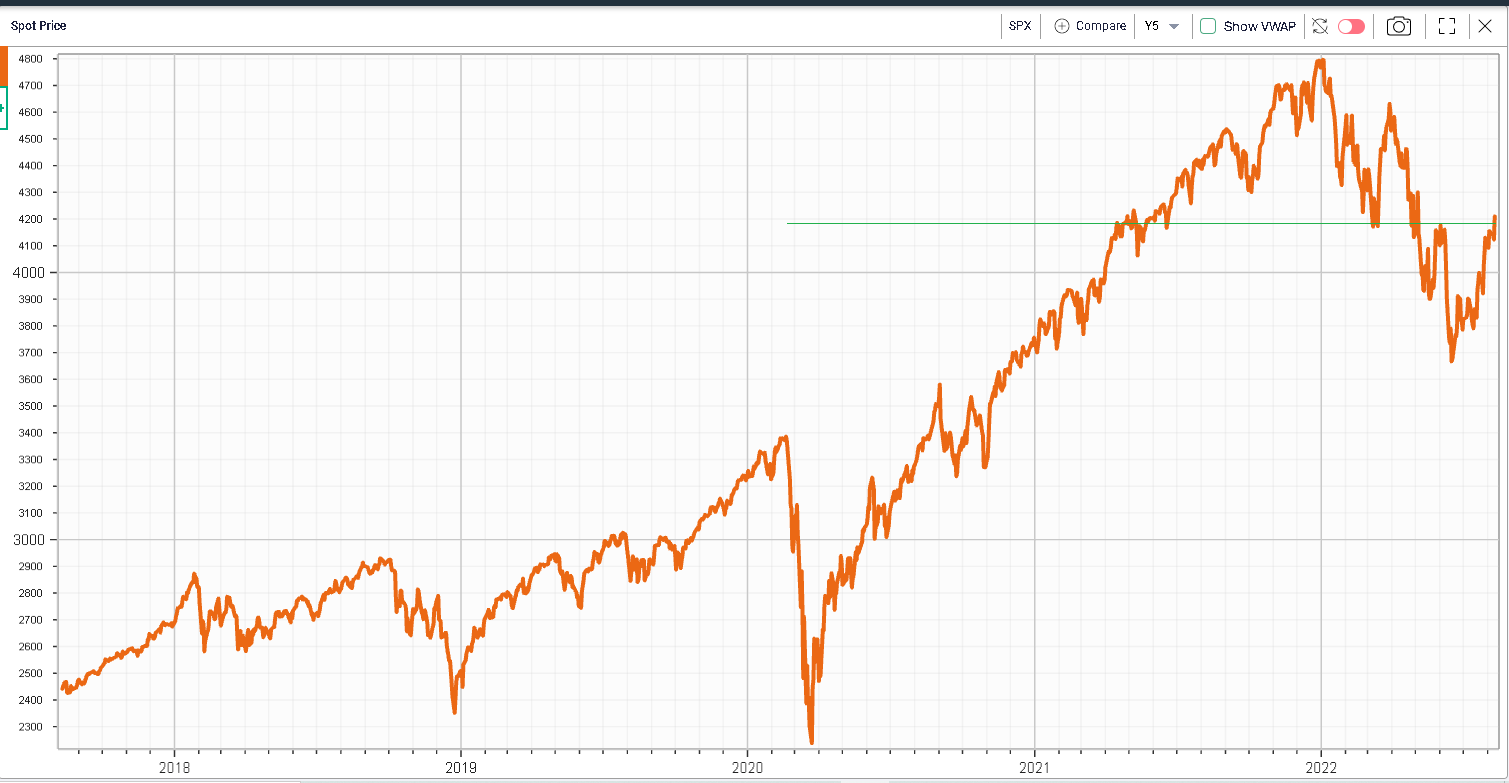
Following yesterday’s reassuring inflation report, markets managed to break out with the SPX closing above 4200 for the first time since early May’22, gaining 2.13% over the day. The NDX settled 2.85% higher and the DJIA gained 1.63%.
At 8.5% in July’22, it is difficult to argue that inflation is now low enough to appease the FED but it is nonetheless lower than the 9.1% gain seen in June’22. Core inflation (ex food and fuel) was steady at 5.9%.
In fact, most of the rhetoric from FED speakers following the event seems to have been on the more hawkish side, trying to play down the meaning of a one good number for inflation on the overall FED policy.
Either way, the SPX has now broken out of the serious 4150-4200 zone which will have undoubtably given a lot of confidence to bulls about the potential upside for the index from here.
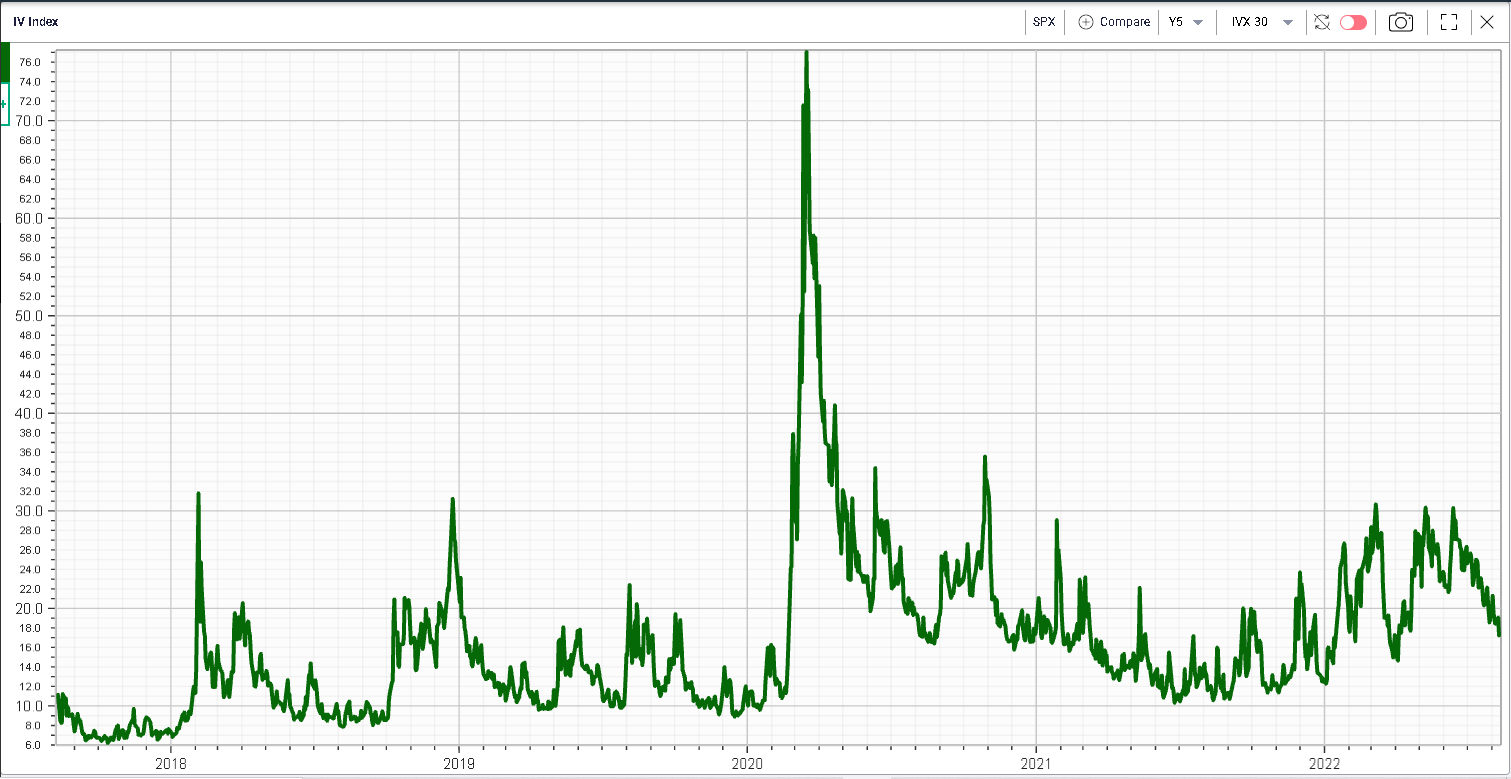
Looking at volatility, it continues to drift lower with 30d IVX at 17.21% as of yesterday’s close. Looking at the below, the importance of the 30% level for 30d IVX is quite clear and was tested on three separate occasions this year without breaking.
In today’s market update, we also wanted to quickly introduce our REST API solution. We have recently released a Python wrapper to help users get started as well as some very interesting examples.
It is a fairly unique product that offers access to a wide range of real-time as well as historical data. It lets users build their own tools, perform their own back-tests, not based on theoretical values but on the actual values that were trading in the market at the time. For instance, our EOD RAW IV calls not only return the best bid/offer available but also volume, open interest, implied volatility and Greeks. Historical intraday data is also available for those traders that require high-frequency data in their analysis. Our data solutions are used by some of the world’s largest institutions and we have now opened this product to all types of investors whether professional or retail traders.
If you want more information about the product, the services and pricing, please write to us on sales@ivolatility.com or support@ivolatility.com and we will endeavor to assist you.
One of the questions customers often ask us is whether the API is difficult to use. My example is quite telling in that respect. I have no experience as a developer. In fact, I spent most of my career trading options so when I was asked to test the API, I was a pleasantly surprised. The Python wrapper as well as the documentation (available here: https://redocly.github.io/redoc/?nocors&url=https://restapi.ivolatility.com/api-docs) makes it fairly easy to get started and start making your first calls.
A few days ago, a former colleague told me to take a look at stocks position relative to their 50 days moving average. He argued that this rally from the bottom in mid-June had lifted all boats and pointed to the proportion of stocks that were now trading above their 50 days moving average as evidence of that. I wanted to check this fact so quickly headed up to the API documentation to figure out how to test this for myself.
Using a bit of code (no more than 40 lines), I managed to create the following chart that displays the proportion or stocks that are trading above the 50 days moving average.
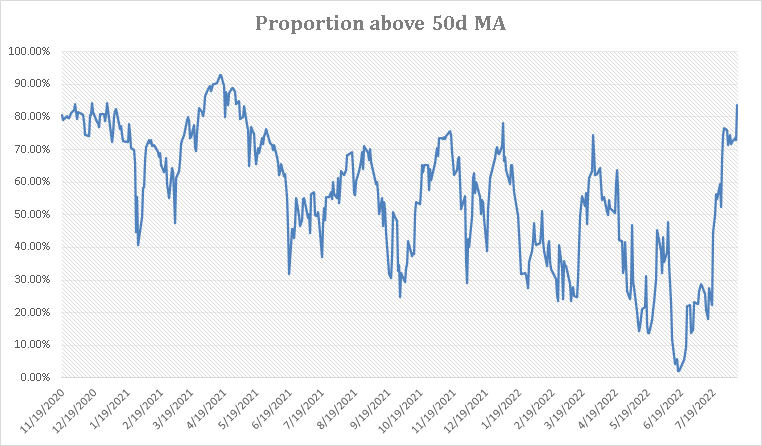
As of yesterday, that proportion was higher that at any point in 2022, and higher than at the beginning of the year with currently 81% of SPX components trading above their 50d MA.
This type of analysis can be systematized using a little bit of code and some properly designed REST API. Feel free to reach out for more information. We also offer a quant for hire service, here again feel free to check with us for more details.