Are index hedges historically low?
August 12, 2022
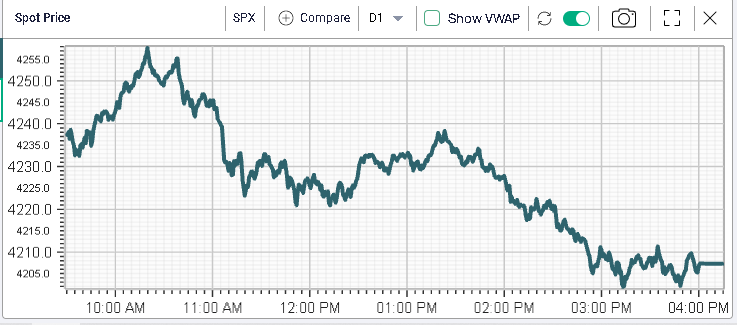
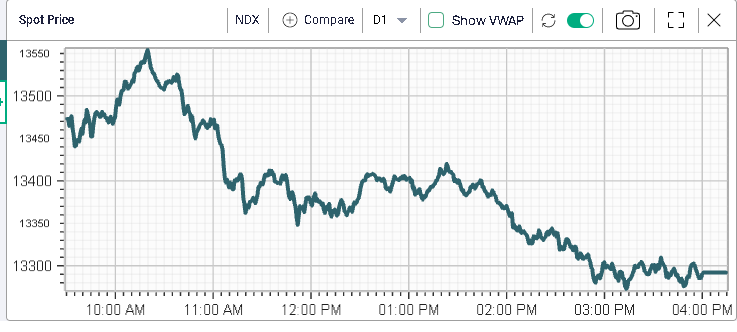
The market continued to push higher right after the open to 4255 on the SPX and 13550 on the NDX. Some selling pressure emerged around those levels, partly as 10y US yields started to move back up.
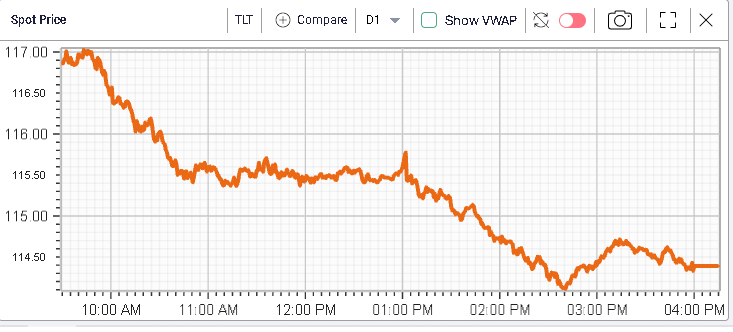
Long bonds were sold most aggressively, with the 10y gaining almost 0.14% over the day. Below we show the price of TLT, an ETF composed of bonds with maturities longer than 20 years to represent that move over the session.
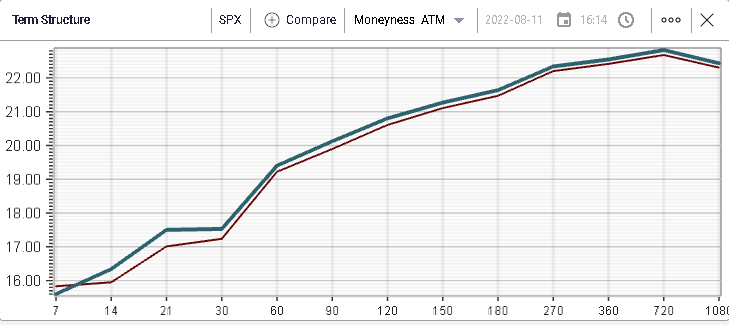
Turning onto volatility, implied volatility shifted slightly higher yesterday, led by the front-end.
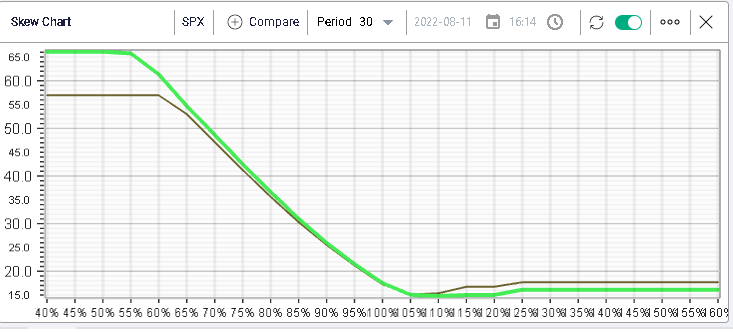
Looking at skew, it seems that downside options became slightly more expensive over the session while upside options cheapened over the day.
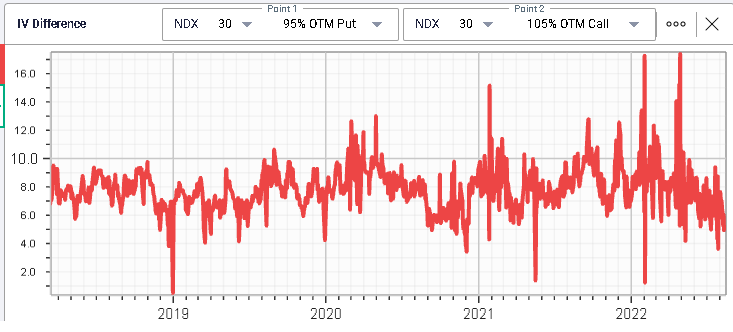
This prompts us to look further into the difference for instance between a 95% put and a 105% call as shown below. It shows an interesting picture whereby the put is now only 6 points higher than the call which is pretty much the smallest premium seen in the last 12 months.

This would probably encourage traders who are looking to hedge to buy puts in the market to take advantage of that relative cheapness explaining the outperformance of puts over yesterday’s session. The same observation can be made on the NDX as shown below.
Turning on to the RT Spread Scanner, we can request that the system offers the most attractive puts with expiration no further than end of Sep’22.
By ranking on Risk/Reward, the system would then be able to sort the possibilities returning the following table for the SPX:
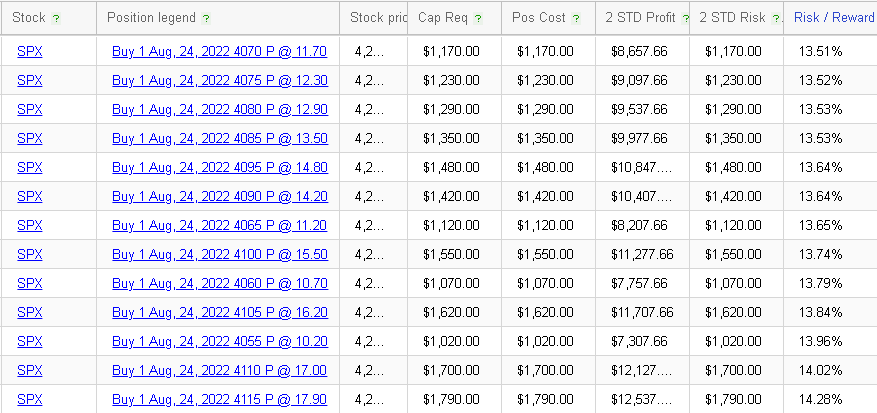
Here, the most attractive options from a Risk/Reward perspective are for expiration date the 24th Aug’22. For instance, the 4070 puts would cost $1,170 to buy and deliver a 2 standard deviation profit of more than $8.6k ie 7.4 times the initial investment.
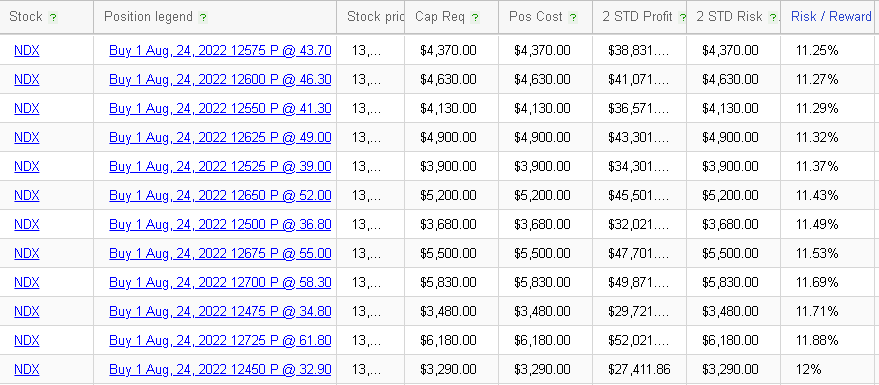
For the NDX, we get the following table with the 24th Aug’22 12575 puts offering an even more attractive 8.9 times the initial investment of $4,370 for a potential 2 standard deviation profit of $38.831.