Resistances broken, what next?
August 15, 2022
Another bullish week for US and EU indices. The SPX was the best performing index gaining slightly more than 3%. The DJIA gained slightly less than 3% and the NDX was up a bit more than 2.5%. In Europe, indices lagged slightly but still managed to gain around 1.3% over the week.
Implied volatilities reset lower across the board with 30d IVX losing about 2 points for all major global indices over the week except for the DJIA which saw its 30d IVX settle only 0.5 points lower.
In Asia, the NKY closed higher by around 1.2% and the HSCEI was in the red, finishing 0.8% lower.
The breakout of the 4150-4200 zone was clean and saw prices transition towards 4300 fairly rapidly despite a strong attempt by bears on Thursday to push prices lower.
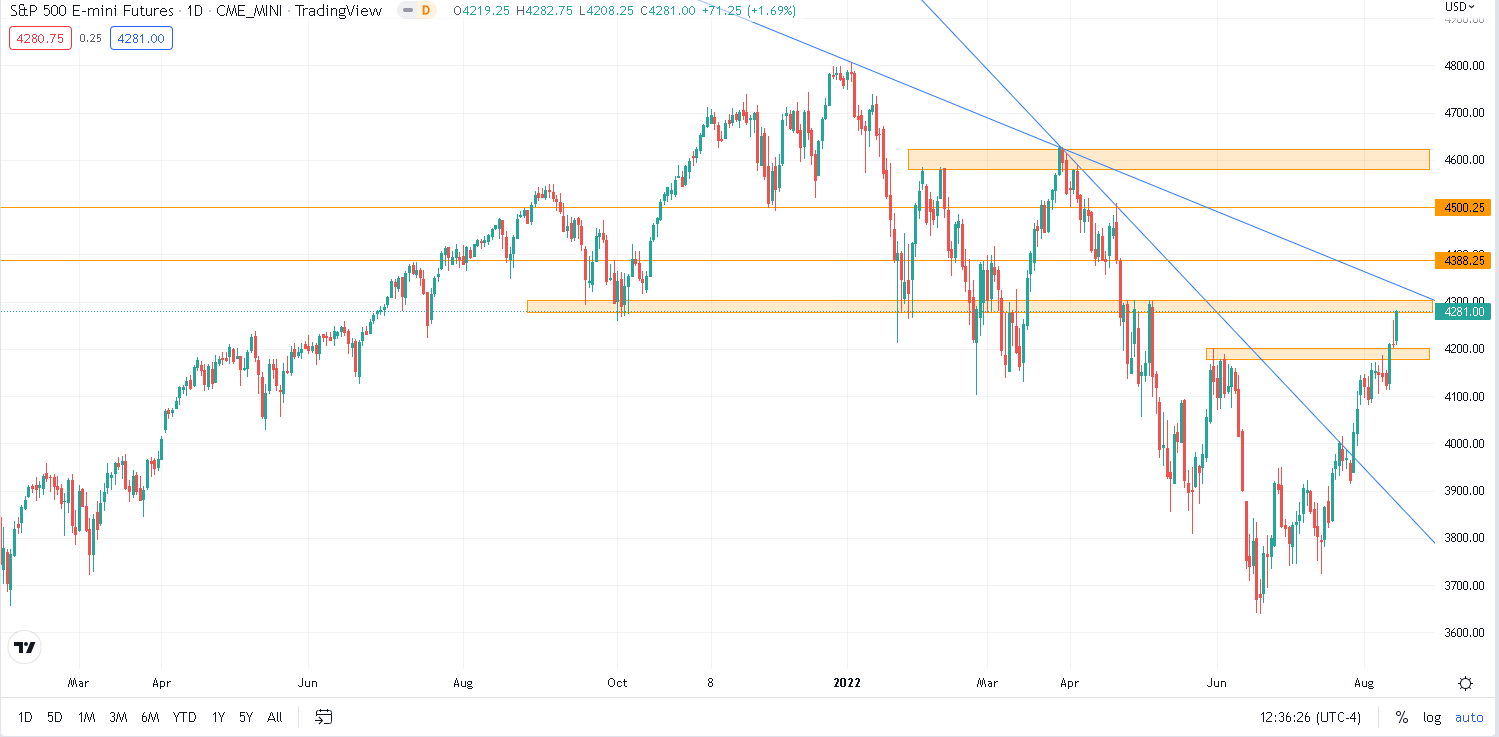
Source: Tradingview.com
On the upside, some resistances are now seen around the following levels: 4300 – 4388 – 4500 – 4600. Fibonacci retracements for the entire move of 2022 point towards 4362 as the 61.8% retracement of the move.
On the downside, supports are seen around: 4166 - 4084 - 4000 - 3926 - 3747 and 3643.
Following the inflation numbers on Wednesday, it seems likely that some traders had prepositioned themselves short going into the figures but the release provided some relief with indices immediately attacking the upper end of the resistance area around 4180-4200. The rest of the price action very much looked like some capitulation and short covering, in particular on Friday with the market performing one of its rare bottom-left, top-right type of session.
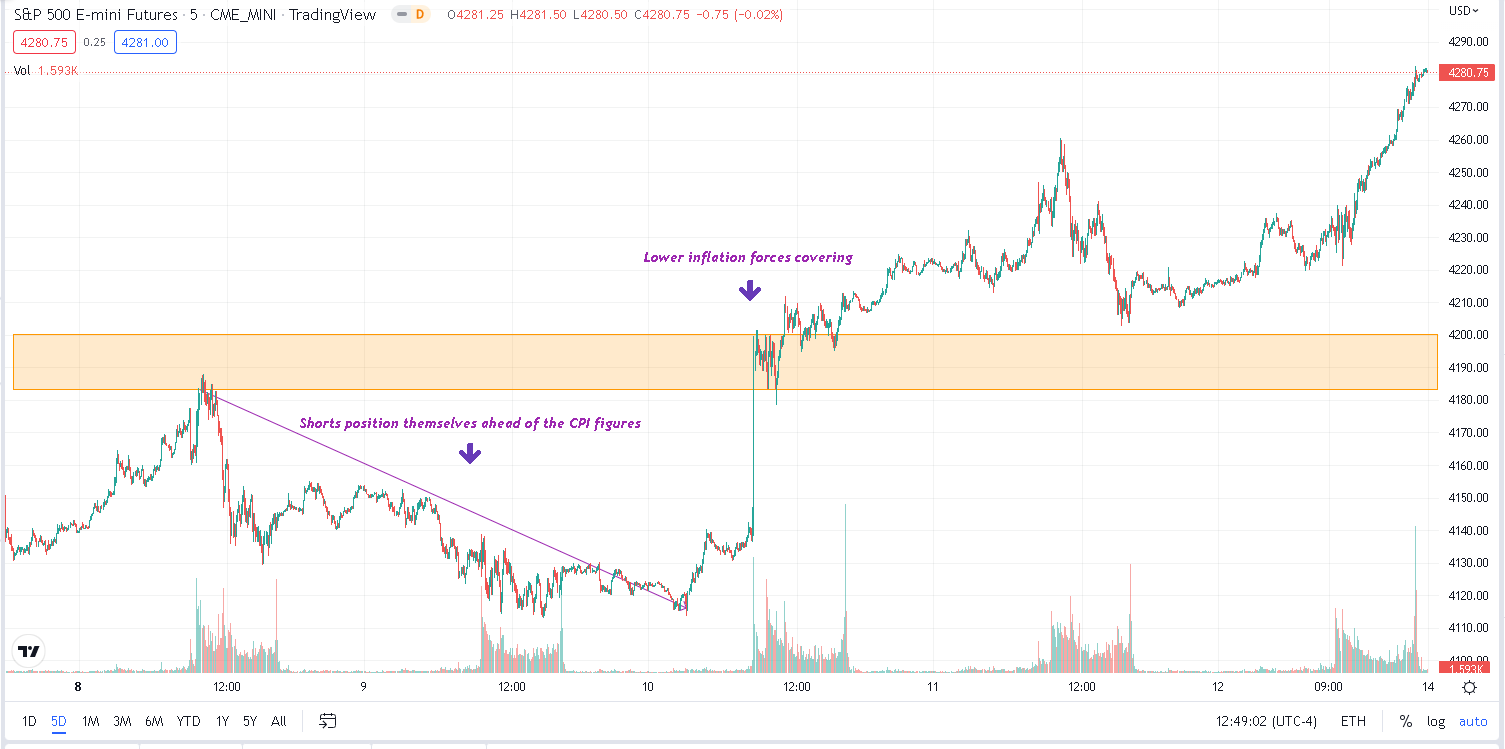
Source: Tradingview.com
Thursday’s price action was interesting, with bears mobilizing and managing to reject 4260 towards a test of 4200 by the close but in the overnight session bulls stabilized prices and the market squeezed on Friday.
It is important to note that volumes have been quite a bit below average recently as shown on the below chart. In blue, we display the 50 days average daily volume for ES contracts and each bar represents the daily volume achieved (green means up-day, red means down-day).
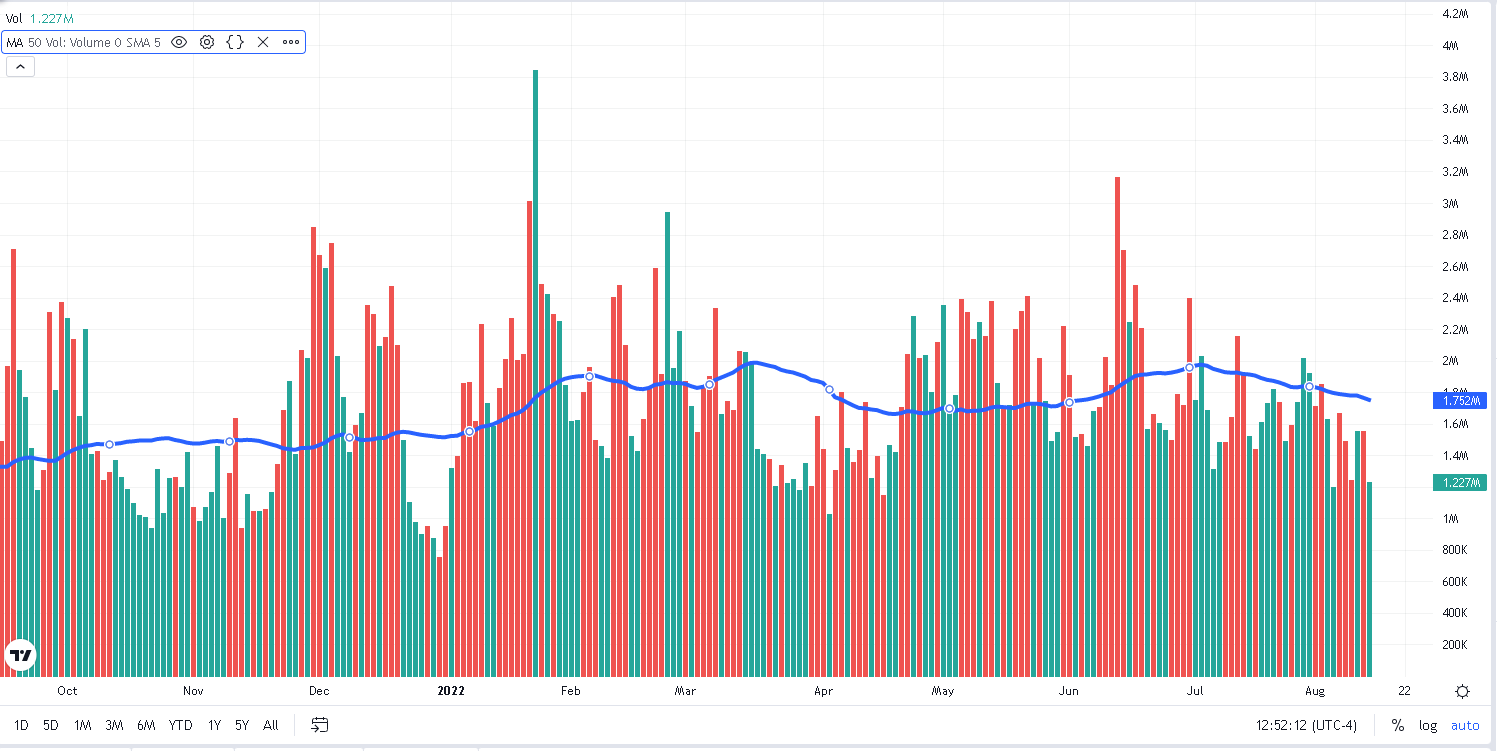
Source: Tradingview.com
Over the past 5 sessions, volumes ranged from 1.23 million to 1.58 million and were slightly below the 50 days average of around 1.75 million.
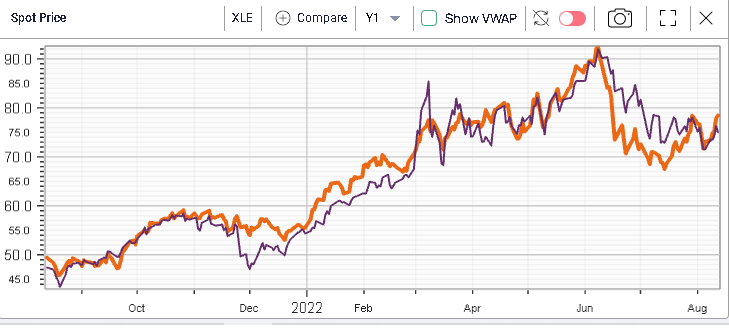
Looking at sector distribution over the week, the XLE outperformed significantly gaining around 7.5% over the past 5 sessions. In fact, judging by the below comparison chart between the XLE and the USO, we can see that the outperformance of equities has now outpaced the performance of crude oil. This is particularly impressive considering that Energy equities had been badly underperforming since the beginning of June on the back of talks about a special tax on energy companies’ profits.
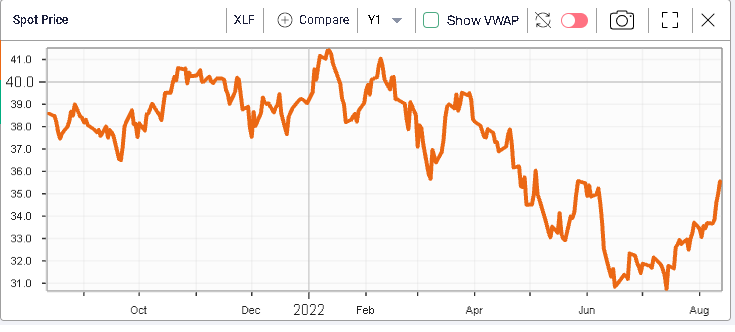
Financials and Materials also performed well on the week, with Financials gaining 5.5% while Materials gained slightly more than 5%.
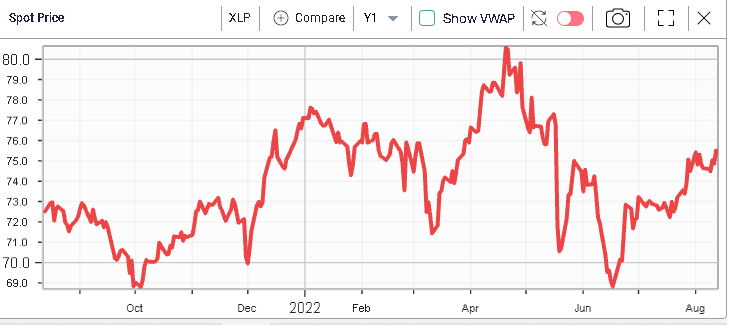
The underperformers included stocks from the healthcare sector which gained 1.5% on the week as well as Consumer Staples which gained slightly more than 1%.