BBBY call volumes explode higher
August 17, 2022
Markets continued to push higher throughout the session with the SPX rallying 30 points in an almost uninterrupted fashion. Some mid-afternoon selling emerged which pushed prices back to the opening level. The index finished slightly higher over the session gaining about 0.2% to 4305.
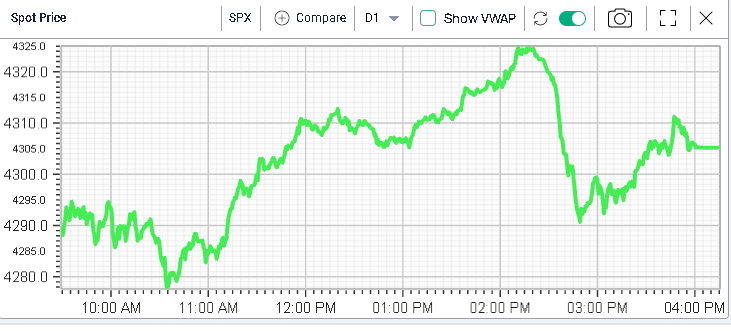
The NDX was slightly weaker on the day closing 0.2% in the red at 13635 and the DJIA was the strongest performer gaining 0.7% to 34152.
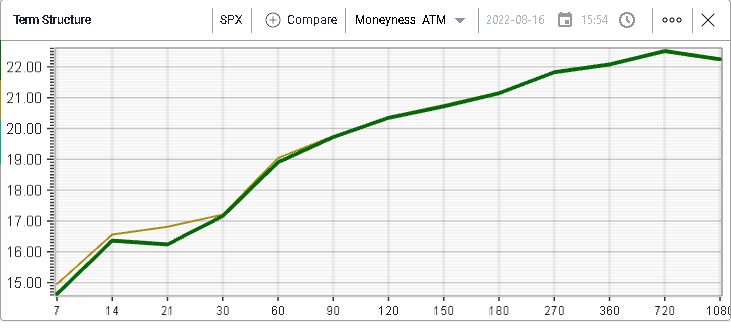
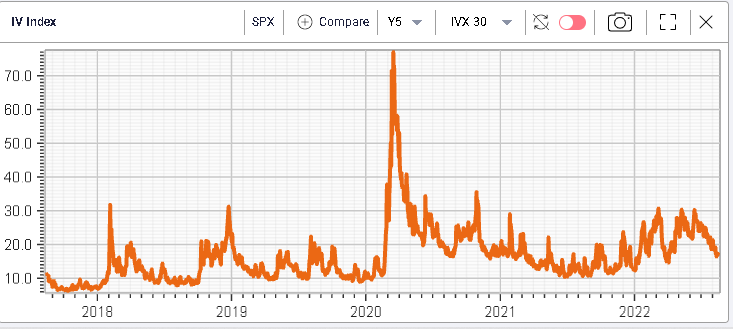
Implied volatilities were largely unchanged over the session with short dated IVs moving slightly lower.
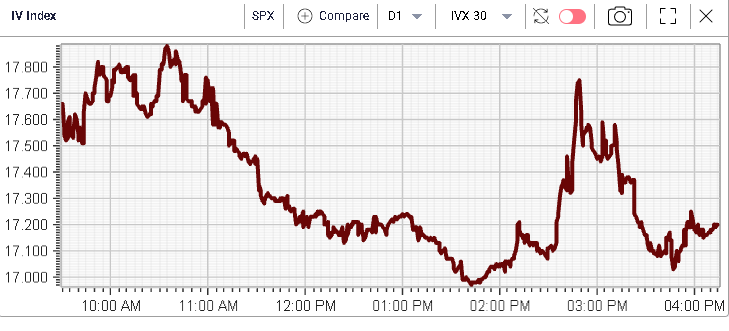
Looking at the intraday changes in 30d IVX, we can see that market makers seem unwilling to own volatility at the moment. The reaction from the selling in spots around 2pm which was both sudden and unexplained is slightly underwhelming and probably shows that traders were not interested to buy options throughout this move.
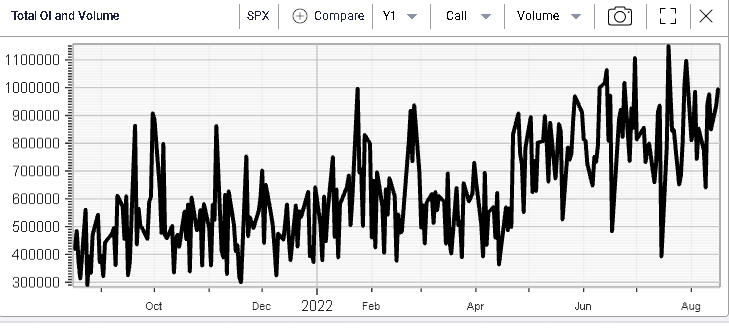
Nonetheless, volumes in options remain slightly above 12 months average (which is not the case for the underlying Futures).
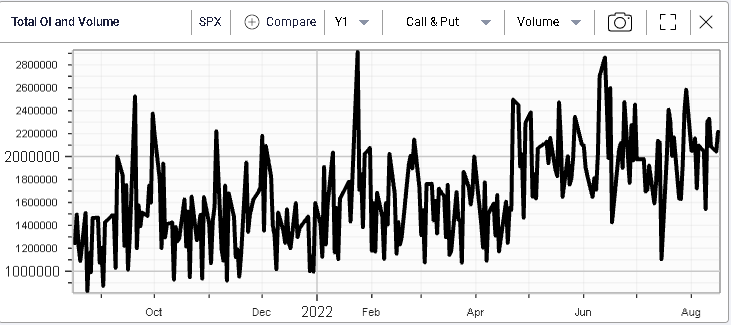
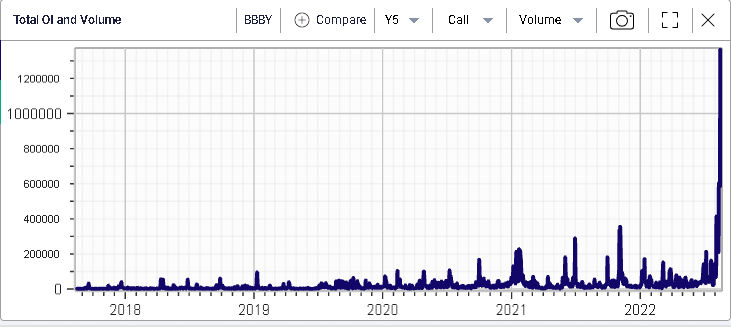
This is mostly driven by call volumes which remain close to their 12 months highs as shown on the below chart.
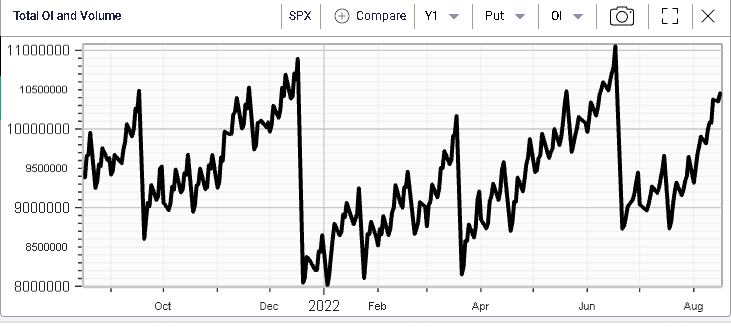
Looking at call open interest, it has increased steadily since the June’22 bottom in the market and expiration. This is true for both calls and puts which is not entirely surprising considering that the moves we saw in H1 would have shattered the confidence of many investors encouraging them to either buy outright calls instead of futures or stocks or to own puts in order to reduce their risks.
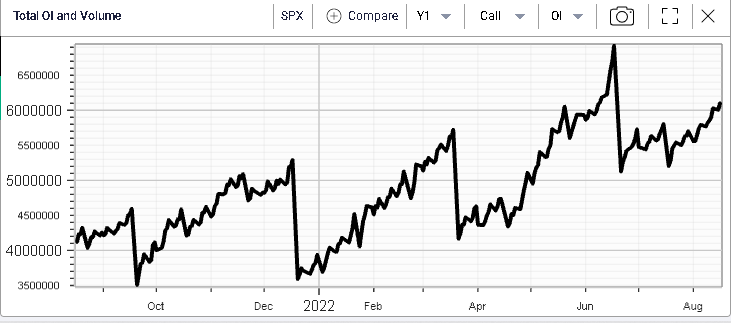
This approach is even easier to implement considering how much implied volatility has dropped recently.
Before closing down this market update, we wanted to take a quick look at BBBY. The stock has seen some extremely aggressive buying over the past few sessions and is now up 36.2% on the year. Over the last 5 days the stock gained 94% and it has gone up 316% over the past month.
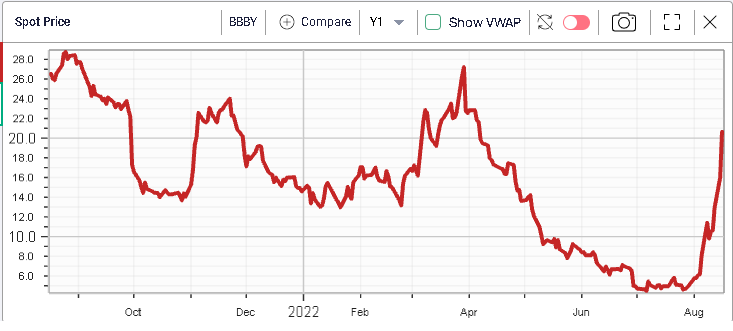
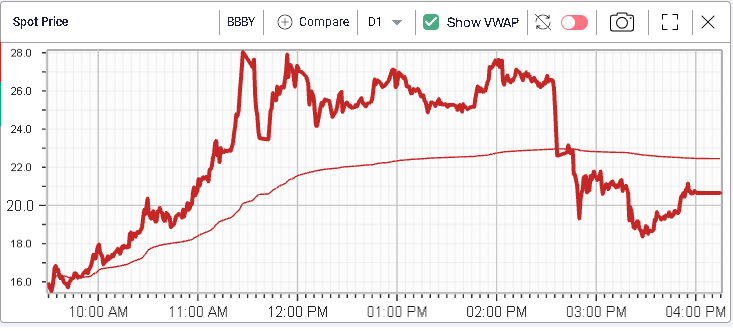
The amplitude of the intraday moves is simply staggering with the stock gaining $12 from its opening price yesterday or about 75%.
This price action seemed to have been driven by call volumes exploding higher with more than 1.36m calls trading yesterday.
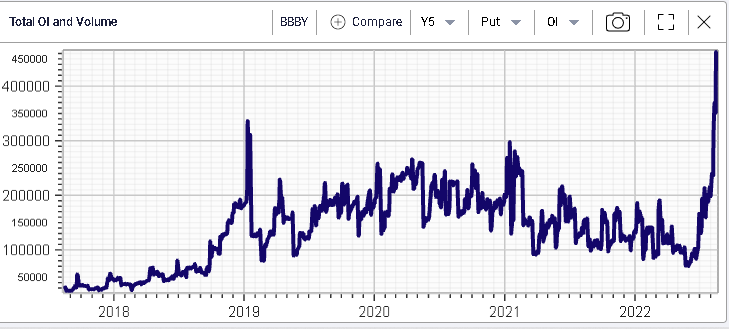
Puts were also incredibly busy as shown below.
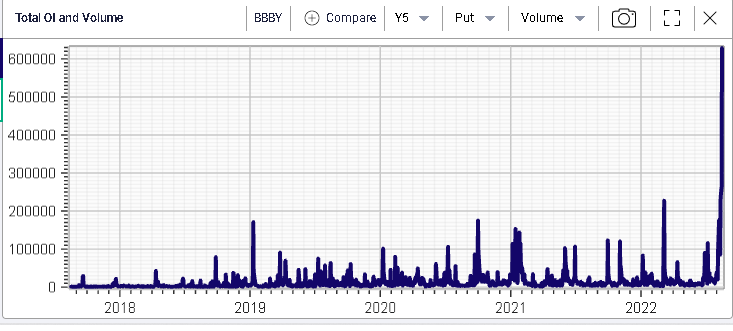
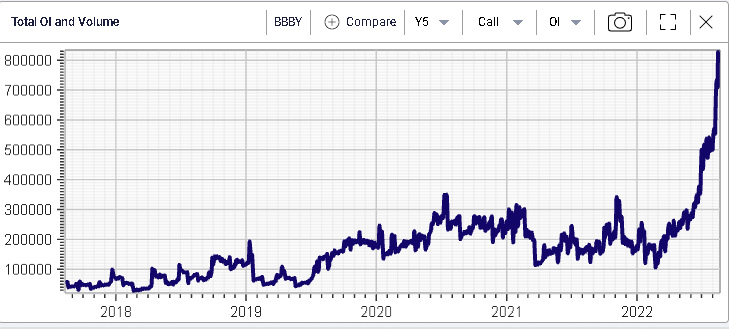
Outstanding option positions are very large with a call open interest of around 800k options at the moment and 450k puts.
According to media reports, the frenzy around the name is linked to the purchase of Jan’23 calls by Ryan Cohen.
- 172k of the Aug’22 45 calls
- 112k of the Aug’22 30 calls
- 100k of the Jan’23 80 calls
- 86k of the Aug’22 20 calls
- 84k of the Aug’22 25 calls
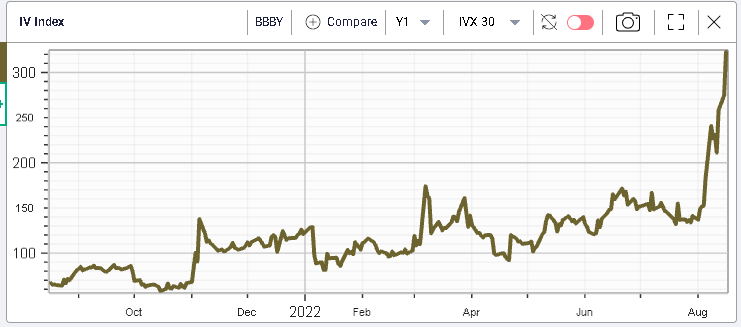
Given the extremely large volumes in options as well as the large moves seen over short periods of times, market makers have had to push implied volatility to above 300% for the 30d IVX.
For a lot of readers and traders the situation in the name will echo what happened in GME in 2021. BBBY is thus a name to keep an eye on in the short-run.