Directional signals using realized volatility
August 18, 2022
US indices continued to move lower yesterday with the SPX losing 0.72%, the NDX -1.21% and the DJIA -0.5%.
Yesterday we published our introductory video of the iVolatility.com REST API which triggered some conversations about the sort of tests that could be made using such a powerful product (more info: https://www.youtube.com/watch?v=Cq4VF8KMBPE)
One fairly basic approach in that respect, is to use volatility as a risk signal and measure it over two overlapping periods in order to assess whether the risks in the market can be considered to be increasing or decreasing.
In the chart below, we display the 20d realized volatility and the 60d realized volatility for the SPY ETF. The blue line is the short term realized volatility and the red one the long term one. We can see that the short-term measure of volatility is more volatile itself than the long term one.
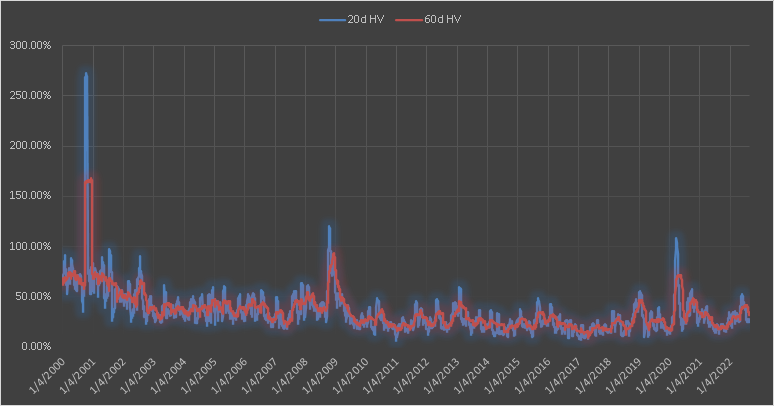
This is quite logical, whenever a large move happens in the market, it will impact the short-term measure by a greater amount than the long term one which will smooth things out.
Creating an index made up of the difference between the 20d HV and the 60d HV, we get the following index that behaves like an oscillator.
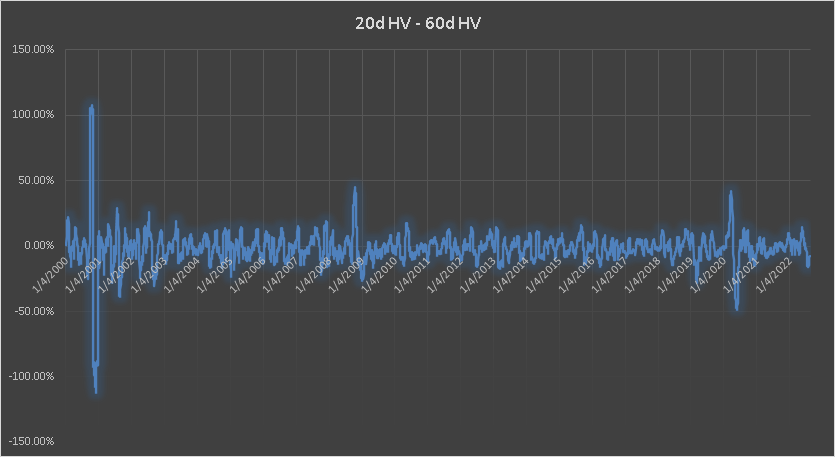
When the difference is high, it means that short term realized volatility is very elevated compared to long term volatility and whenever the difference is low, we have a very low short term realized volatility relative to the longer term one.
The idea of such an oscillator is to try and capture regime shifts when they are starting. Imagine a scenario where all volatilities are low and around 15% annualized. We now see a pickup in short term realized volatility which tells us that we are possibly witnessing a regime shift. The short-term volatility will move higher more rapidly than the long term one and studying the difference might help us notice that change early on.
Working off the assumption that traders have to reduce their positions when volatility increases (either because of their mandate or because of increase margin rates by exchanges), we try to anticipate those flows that could have a compounding effect on the direction of the market until some desirable size is reached by participants.
The below shows the performance of a strategy that goes long SPY whenever the short term realized volatility is below the long term one and short SPY when the short term HV is higher than the long term HV. This is obviously a very basic approach and not at all a rigorous back-test but it shows how using realized volatility can make a lot of sense.
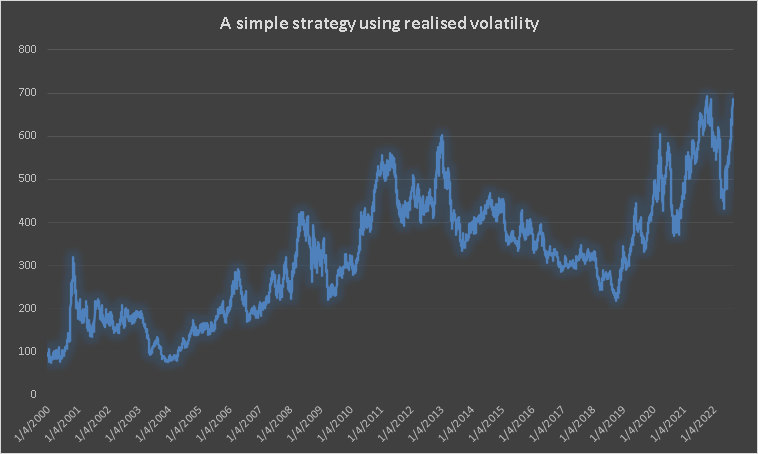
It also shows that even for non-options traders there is a lot of information that can be derived from the study of volatility.
If you need help getting started with the API or with our analytics platform iVolLive, feel free to write to us at support@ivolatility.com