Option volumes analysis, September in focus
August 22, 2022
The big fight last week between bulls and bears was to decide whether we were going to close up or down on the week. Looking at the below, we hovered around the prior close at 4278.5 until early in the European session on Friday when bears finally took the advantage. The SPX settled around 1.15% lower on the week.
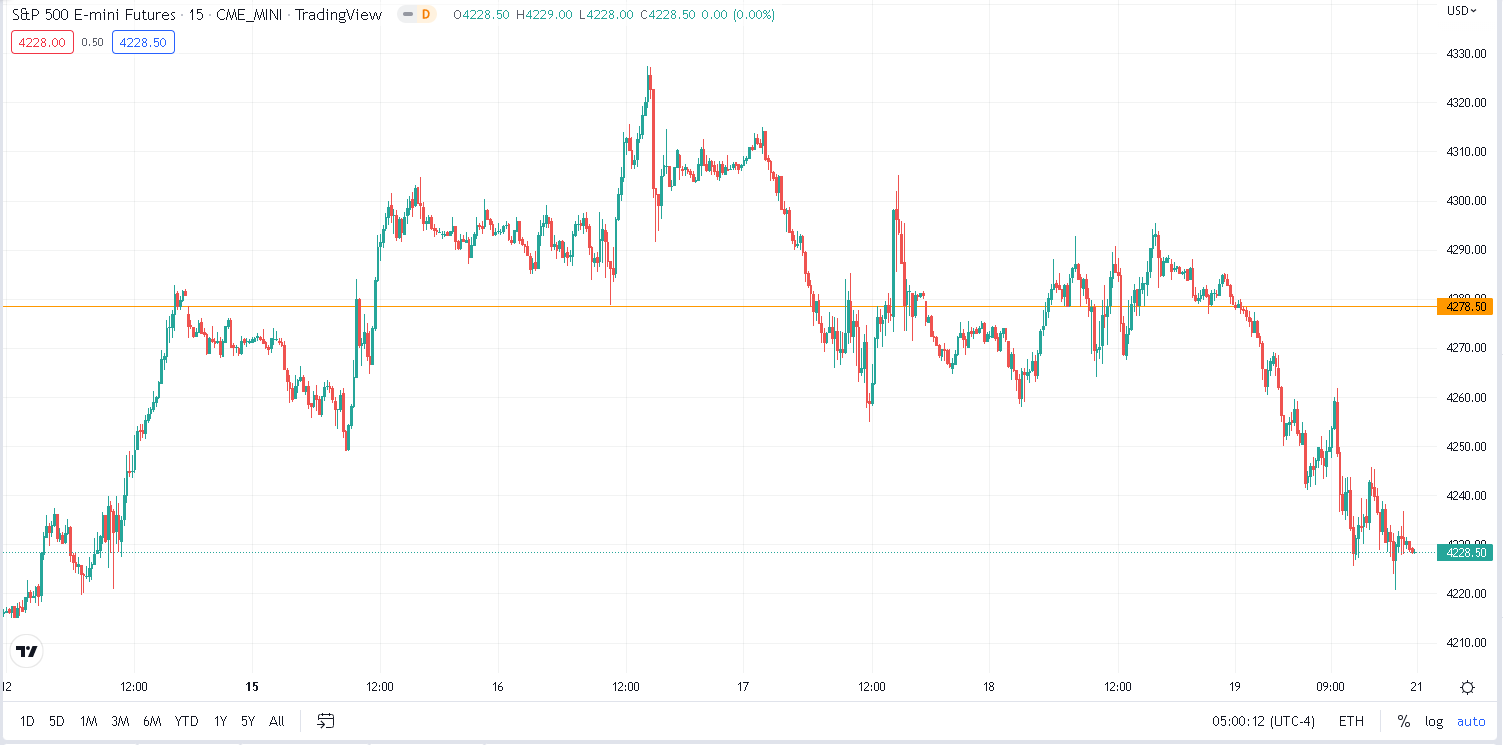
Source: Tradingview.com
Things were slightly different for the NDX which was under much more pressure and from Wednesday onwards, the index failed to regain the prior week’s closing price. It finished the week around 2.5% lower.
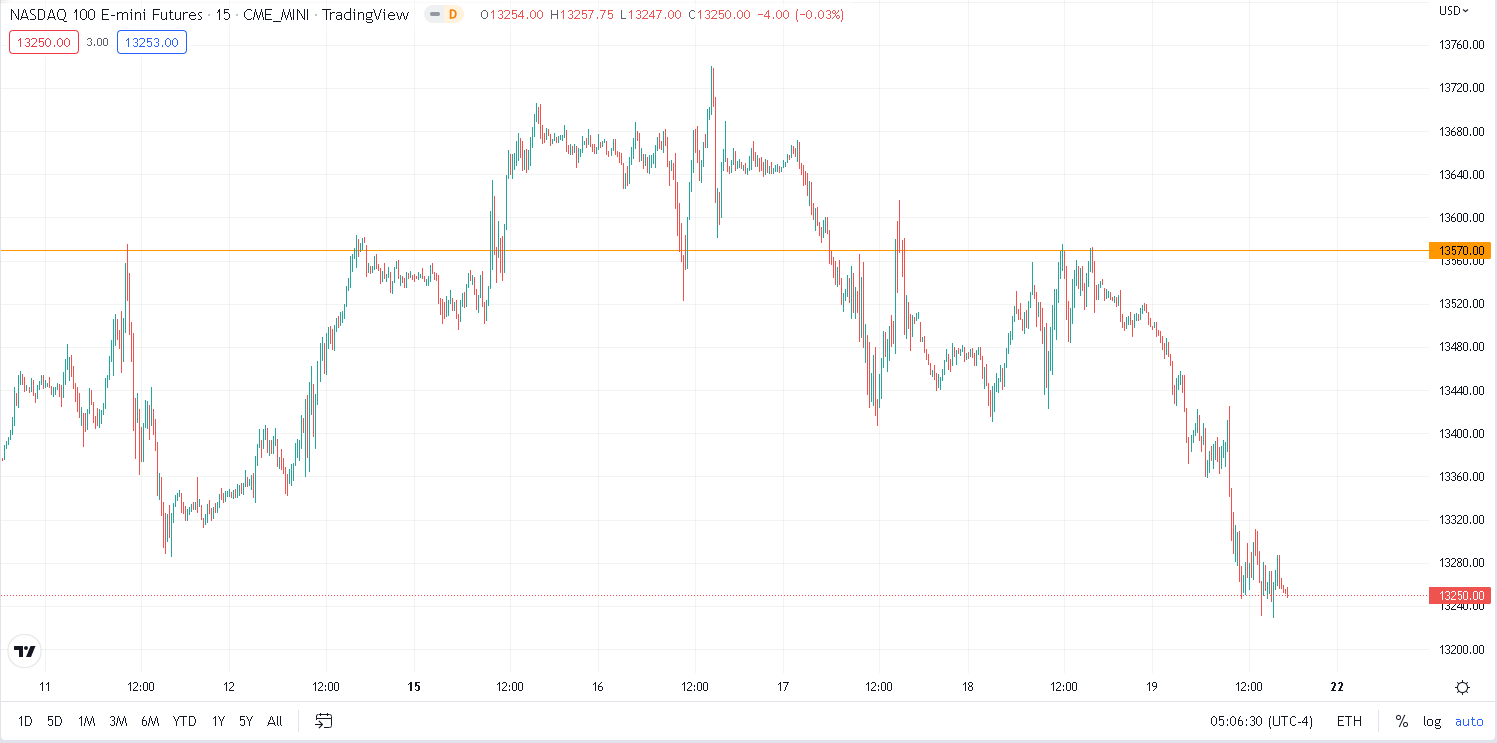
Source: Tradingview.com
European stock indices were also very weak early on with a very intense selloff happening around Wednesday that pushed DAX prices 300 points lower and kept them under the prior week close for the rest of the week. The DAX finished around 2% lower on the week.
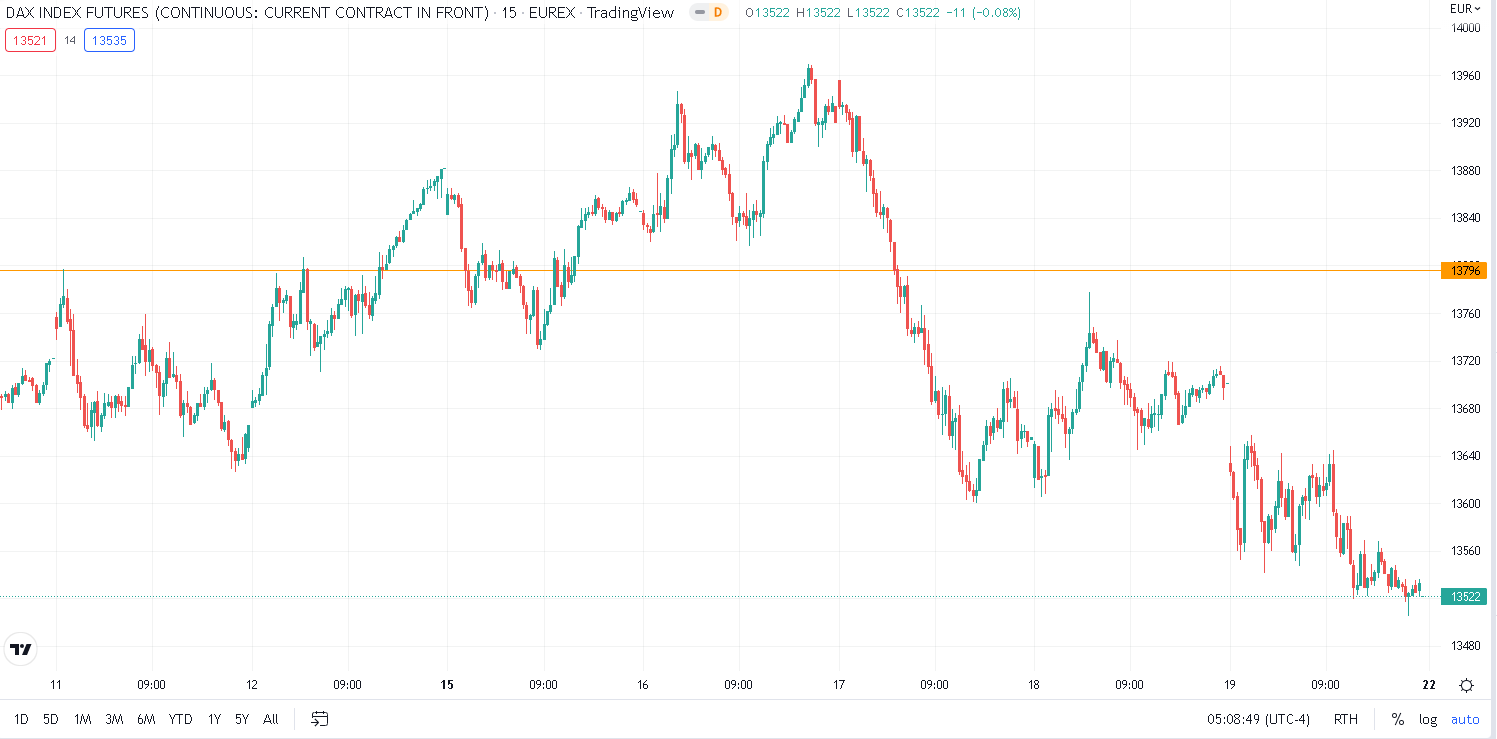
Source: Tradingview.com
Finally, the French CAC fared slightly better following Wednesday’s selloff but eventually broke lower to settle around 1% lower on the week.
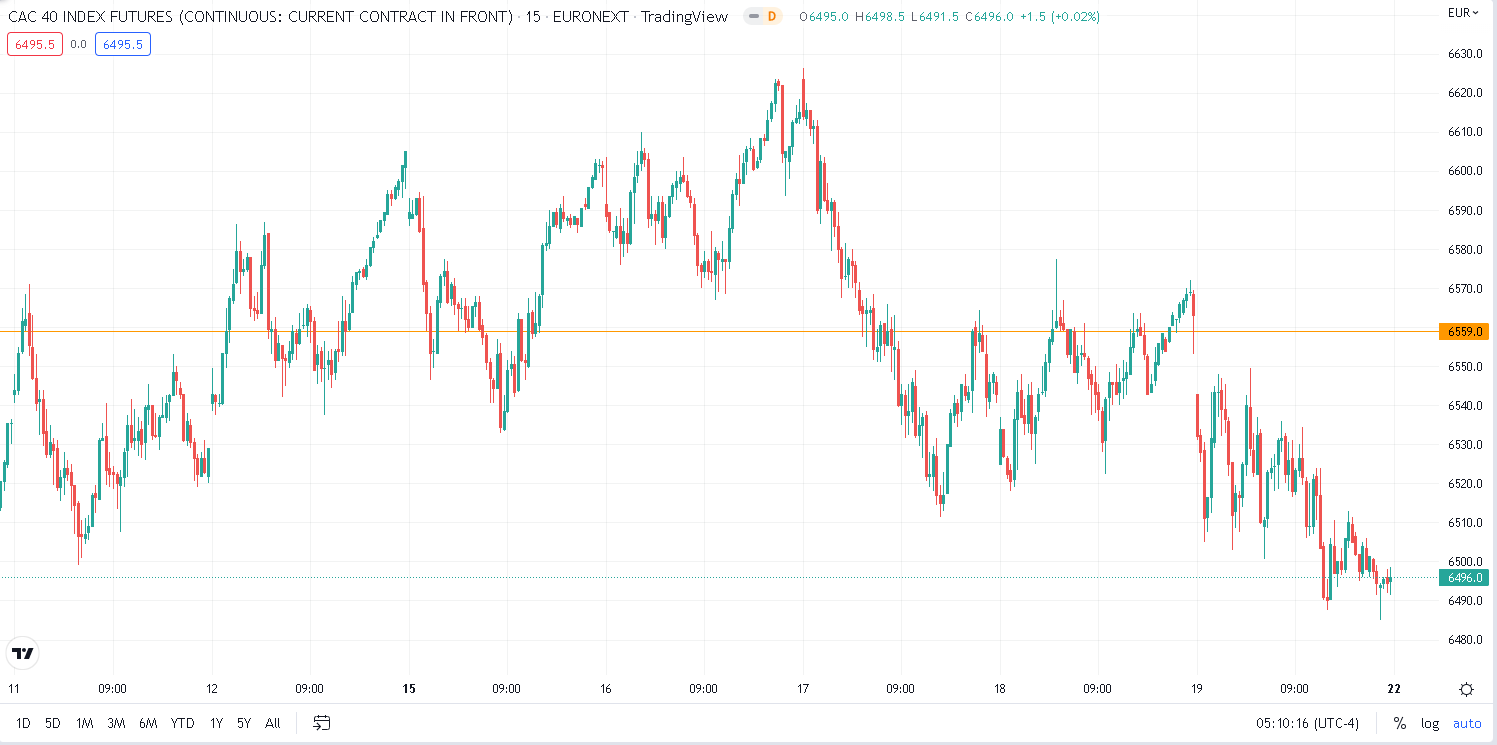
Source: Tradingview.com
As discussed in Thursday’s market update, we are currently seeing a large degree of dispersion in the opinion of participants with around 1/3 of traders bullish, 1/3 bearish and 1/3 neutral. Even at an institutional level, media reports flagged this week that some large institutions were in disagreement about the future of stock prices.
Looking at the ES daily chart below, we can see that, from a technical standpoint, the market has been sending some fairly strong signs. The downtrend for the first half of 2022 was broken around the end of July / start of August, the market moved past its 50-day moving average by quite a wide margin and some major resistances were broken recently in particular around the 4150-4200 area.
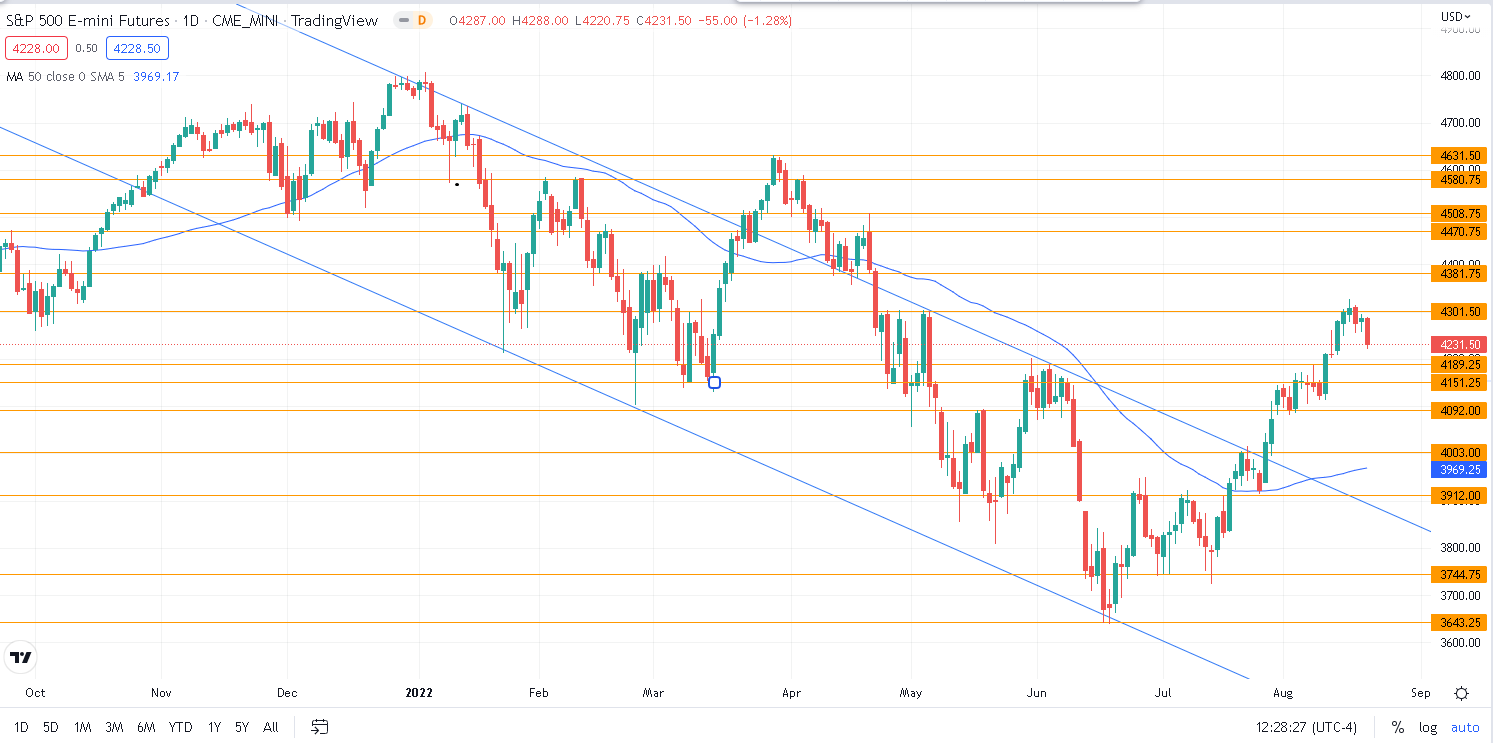
Source: Tradingview.com
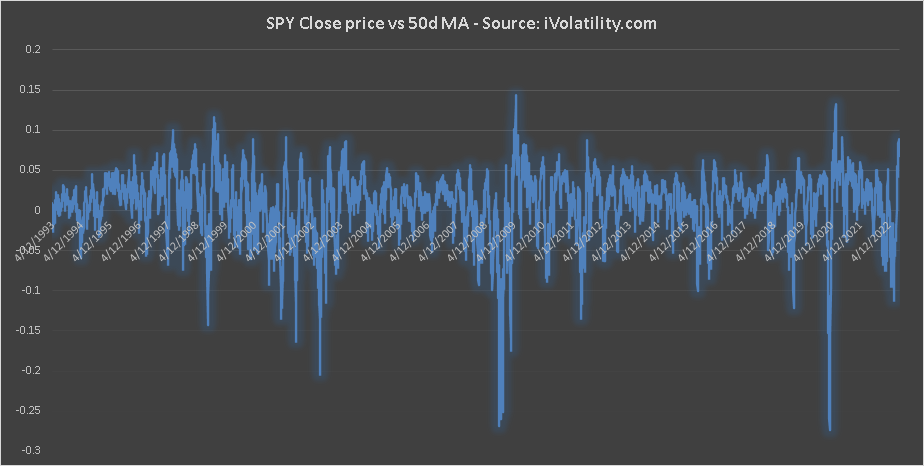
Looking at the distance between the close price of the SPY and the 50-day moving average of the ETF, we see on the below that as of Thursday the SPY was around 8.27% higher than its 50d MA which is fairly elevated historically. Despite the selloff on Friday, the ETF was still trading at a 6.7% premium to its 50d MA on Friday
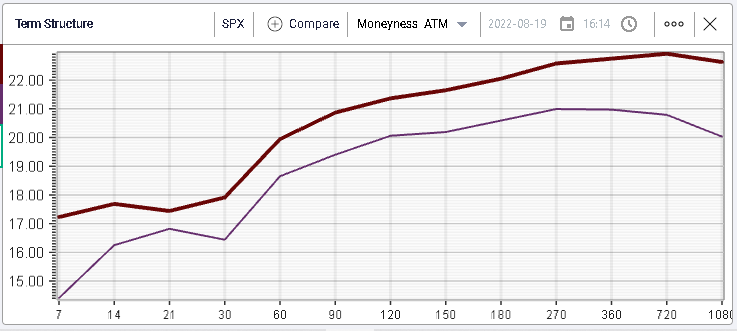
As we flagged earlier in the week, implied volatilities have been falling fairly aggressively over the past few weeks from their recent top around 30%.

Over the week, implied volatilities seem to have found a floor moving higher (although mostly on Friday) with 30 IVX moving from 16.7% to 18%. Short dated options reacted the most with weekly SPX volatility moving from around 14.5% to 17%.
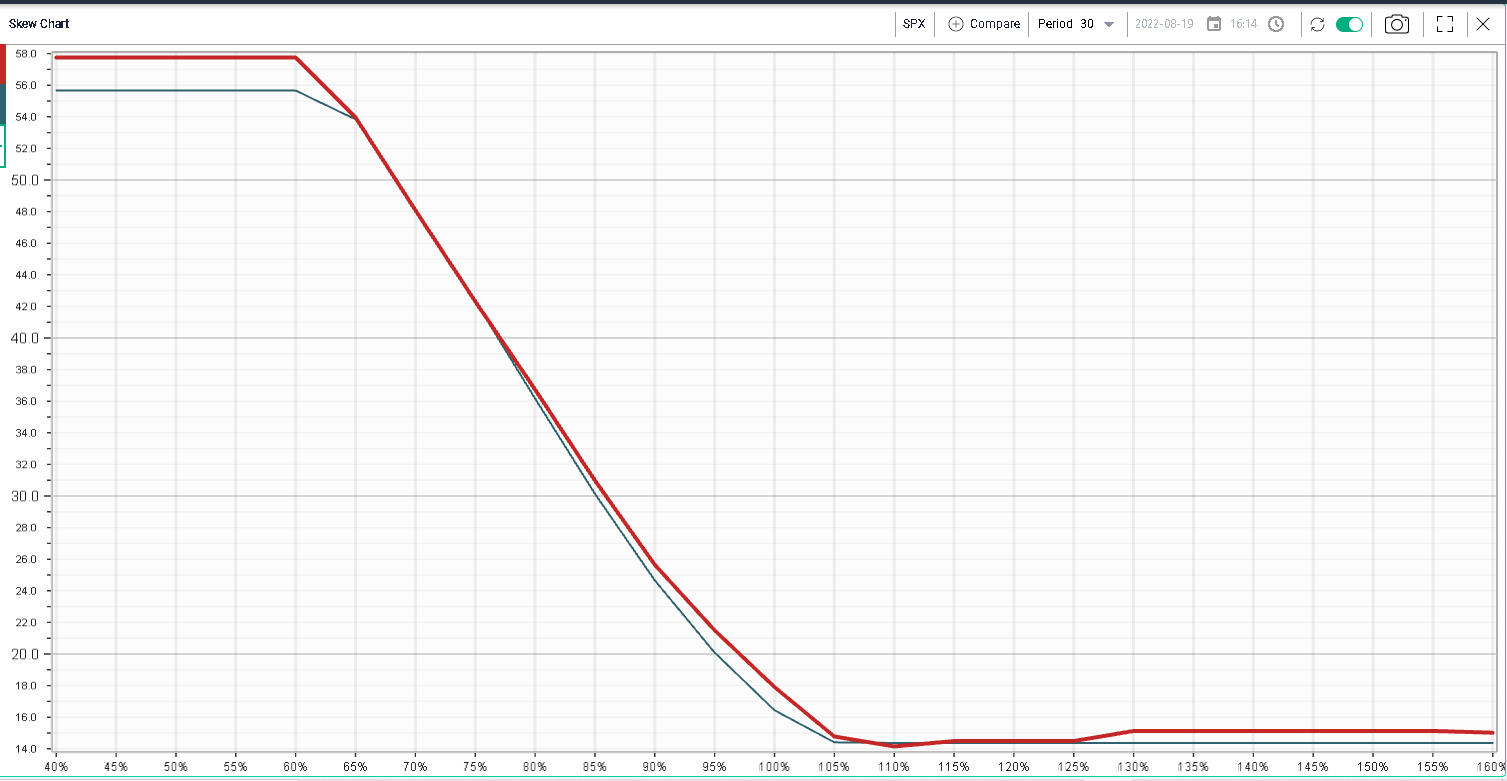
Looking at skew over the week, most of the implied volatility remark was for options around the money and slightly downside. Options market makers pushed implied volatilities higher in reaction to Friday’s price action but not much happened beyond that.
Zooming in on the flows for the week, we saw a lot of activity on short dated options with the August expiration on Friday. Beyond that, September options were fairly active with the 4300 calls trading almost 70k over the week, the 4300 puts trading 60.2k, the 4000 puts trading 45.5k and the 4250 puts trading 44k.
The below chart displays the number of contracts exchanged over the week by expiration. The attention on short dated options is quite visible with almost 52% of all volumes trading on options that expired at some point last week. Wednesday options were actually the most active ones with almost 1.4 million contracts trading over the week.
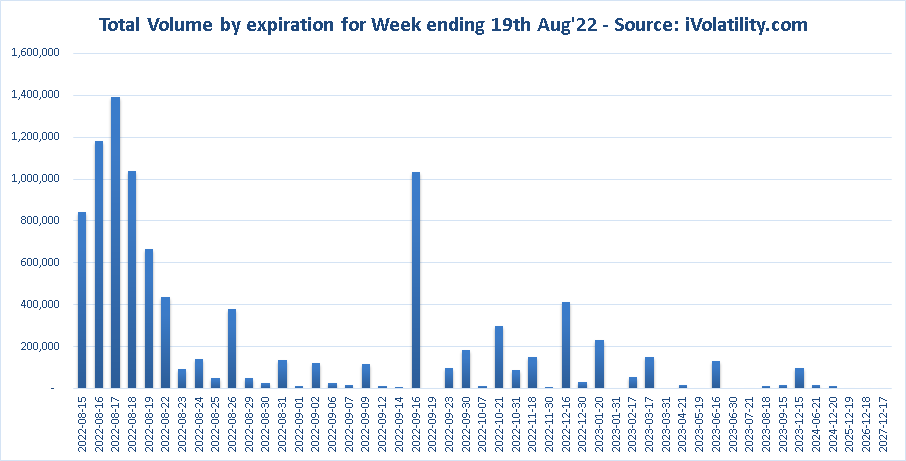
In the above the focus on September is also very visible with more than a million contracts trading on the week.
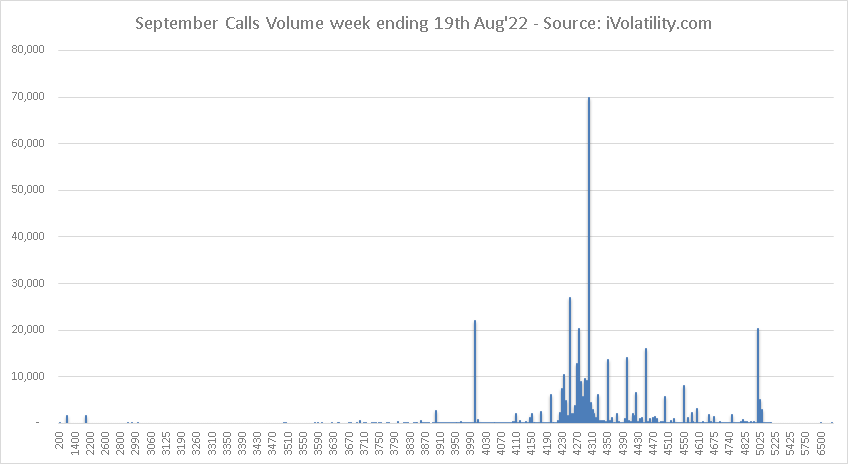
On the call side, the most active options for the 16th Sep’22 expiration are displayed on the below chart. We can see that the vast majority of the focus was on the 4300 calls with 70k trading over the week. In total, around 405k calls traded over the week in Sep’22.
On the put side, volumes were around 627k over the week and the below shows the most active strikes. Those are much less concentrated around one area but quite evenly split with a lot of strikes on the downside seeing some fairly important volumes.