Position squaring ahead of Jackson Hole
August 23, 2022
As traders await the Jackson Hole speech by Fed Powell on Friday, some position squaring has likely been taking place over the past few sessions. Yesterday, the SPX finished 2.14% lower, the NDX 2.66% lower and the DJIA 1.91% lower.
Over in Europe, indices remained weak with the German DAX losing 2.3% and the French CAC finishing 1.75% lower. During yesterday’s session, the EURUSD pair broke parity and has stayed under that level for now. This is the latest sign of all the troubles that have hit the Euro-Area in 2022 with economies being hit by an energy crisis, the need for the ECB to raise rates to calm inflation down and the overall slowing of the economy that seems to be pointing to a possible recession over the next few quarters.
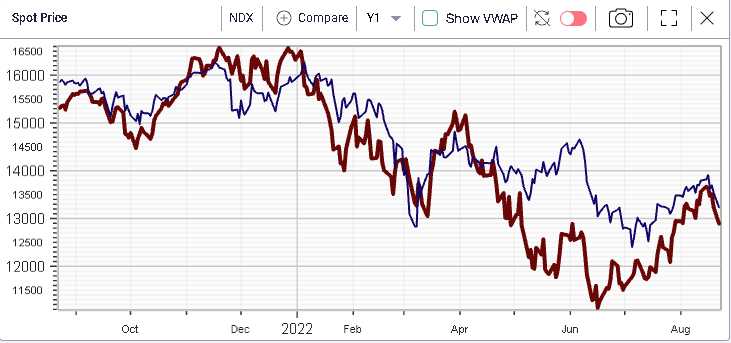
During the Jun’22 selloff in US equities, it felt like European assets were more resilient. That outperformance has now melted as seen on the below NDX vs DAX chart comparison.
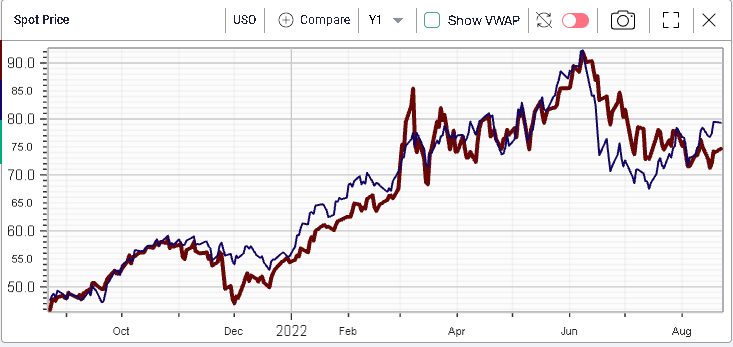
Looking at sectors yesterday, the Energy segment continued to outperform losing only 0.19% on the day as Crude Oil prices were supported. That performance was attributed by media reports to comments made by Saudi Arabia flagging that OPEC+ output could be cut if Iranian oil was to return to the market. The XLE has continued to outperform USO over the past few weeks.
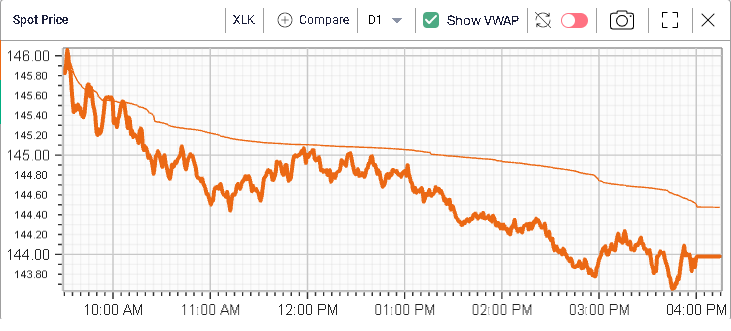
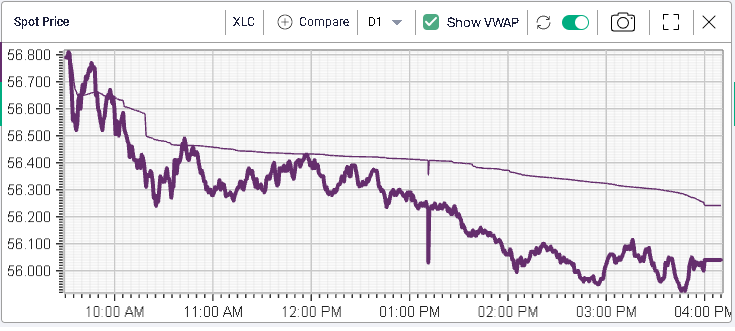
Worst performing sectors were found in the Technology, Communications and Consumer Discretionary segments all losing around 2.8% over the day.
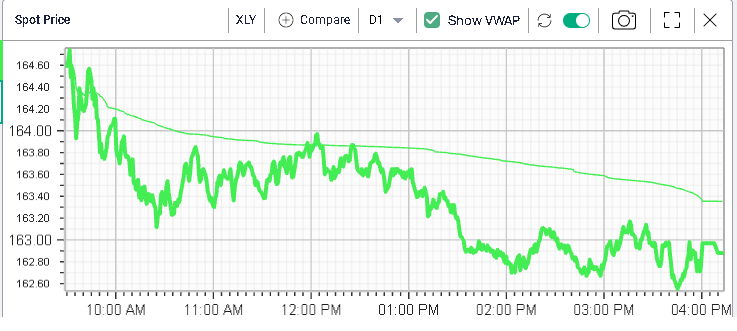
The selling in those three sectors felt continuous throughout the session and prices spent pretty much the entire day below VWAP.
The chart below shows the implied volatility measured by using the 30d IVX for all three sectors with Tech in red, Comms in purple and Consumer Discretionary in green.

All three implied volatilities rose by around 4 points over the session and are now slightly higher than average against their 12 months history.
Looking at SPX implied volatility, all terms remarked higher with the front-end now starting to invert.
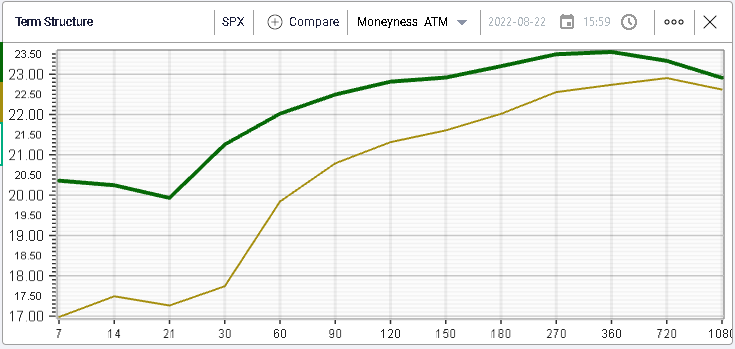
7 days options are now priced at 20.36%, 14 days options at 20.25% and 30-days options at 21.26%.
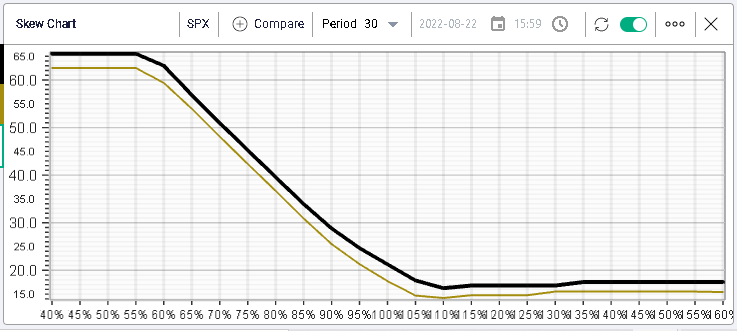
Looking at skew for 30 days options, we can see that all strikes moved higher with options concentrated between 95% and 105% moving the most over the session.
Volumes were "only" slightly above average during yesterday’s session which may also indicate that traders are paring positions and not necessarily adding to new positions yet on the short side.
