When the fixed income market speaks, equity traders listen
August 24, 2022
Equities seemed to stabilize yesterday with the SPX dropping a mere 0.22%, the DJIA losing 0.47% and the NDX finishing 0.07% lower.
In today’s market update, we want to take a quick look at the fixed income market via the prism of bond ETFs:
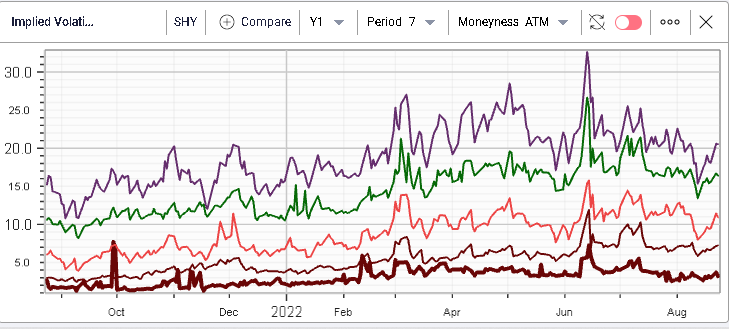
- SHY: iShares ETF tracking an investment in bonds with maturities ranging from 1 to 3 years.
- IEI: iShares ETF tracking an investment in bonds with maturities ranging from 3 to 7 years.
- IEF: iShares ETF tracking an investment in bonds with maturities ranging from 7 to 10 years.
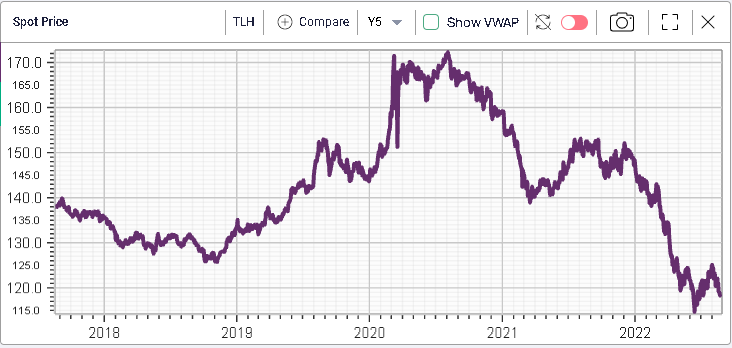
- TLH: iShares ETF tracking an investment in bonds with maturities ranging from 10 to 20 years.
- TLT: iShares ETF tracking an investment in bonds with maturities longer than 20 years.
Those 5 ETFs let us track a different part of the yield curve to gain some understanding of how things have been moving this year.
Price changes:
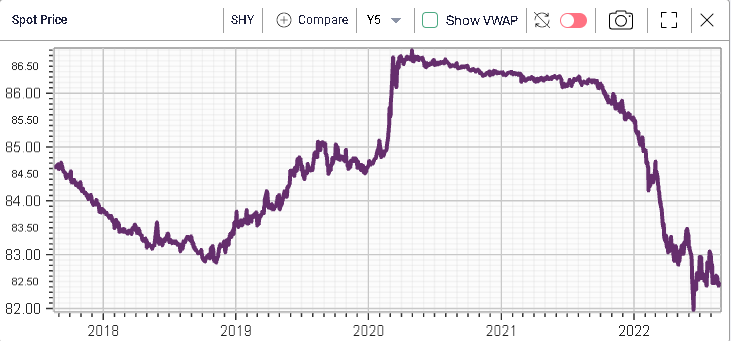
SHY has lost 3.49% on the year.
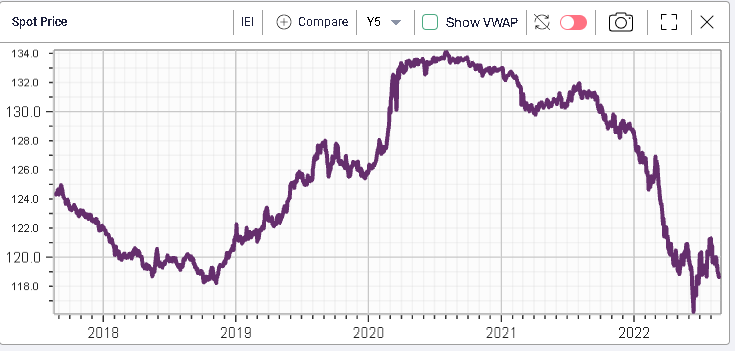
IEI has lost 7.42% on the year.
IEF has lost 10.66% on the year.
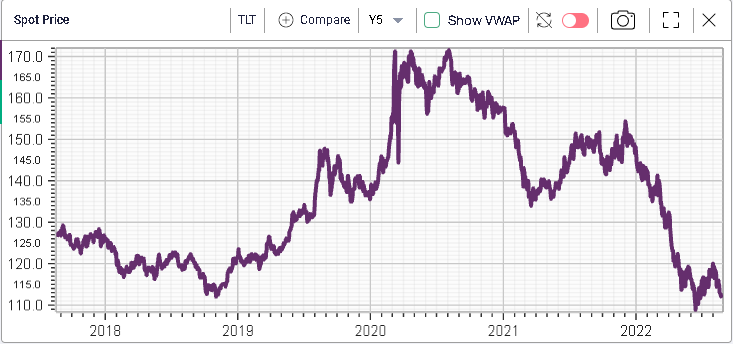
TLH has lost 18.82% on the year.
TLT has lost 22.36% on the year.
Those moves are quite significant as bonds are generally perceived to be the safe part of a portfolio. Loosing 18.82% over a year in 10 to 20 years bonds does not happen very often.
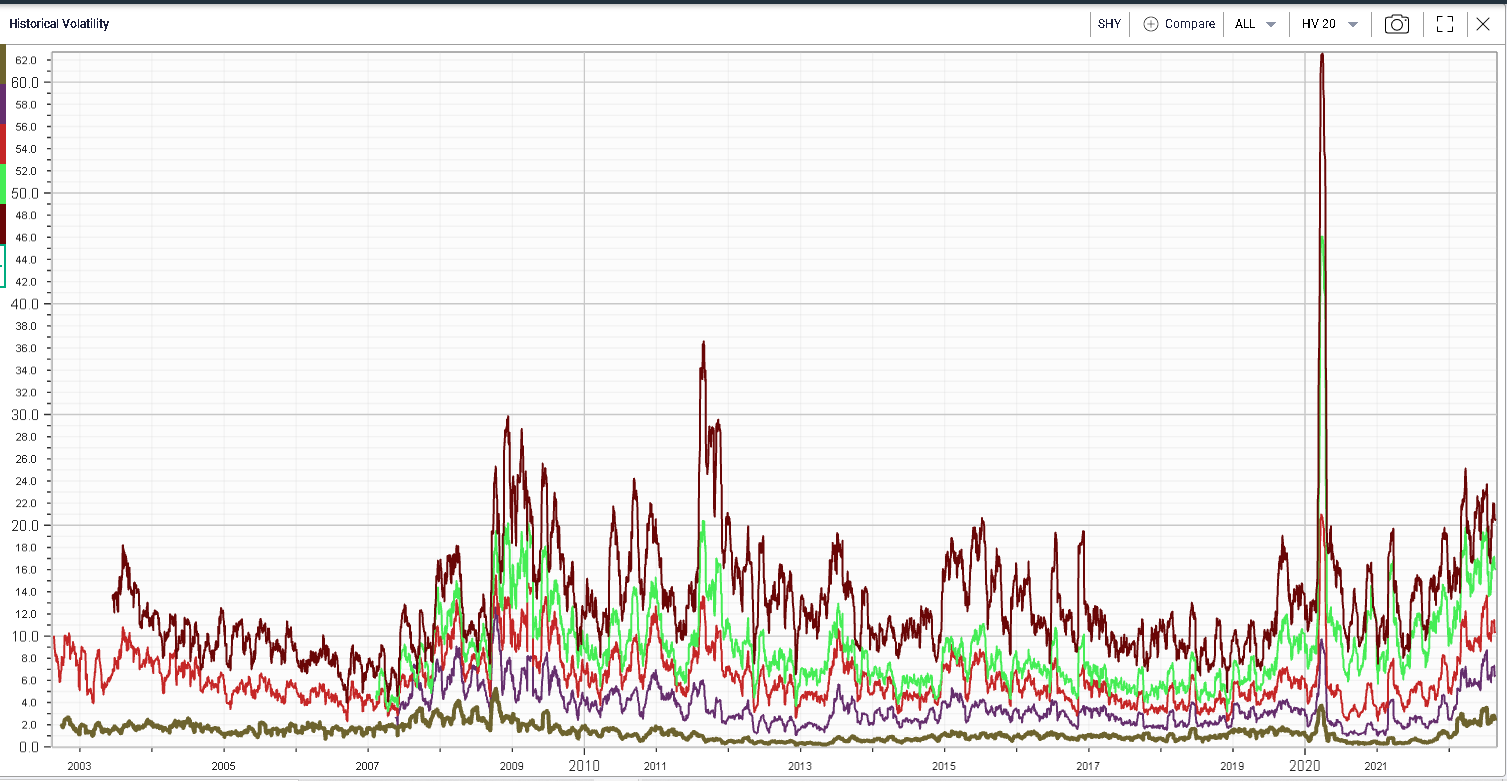
As a result of those large price swings throughout the year, historical volatilities for those ETFs have moved higher and seem to have reached levels only seen in crisis period (global financial crisis, pandemic etc.)
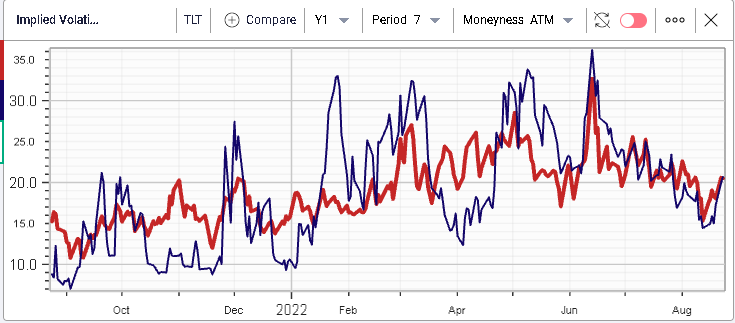
Looking at implied volatility for TLT, we can see on the below chart that fixed income options traders had done a pretty good job anticipating a move higher in implied volatility for 2022 with the purple line displaying the implied volatility by maturity at the start of September 2021 and the yellow line as of the start of 2022.
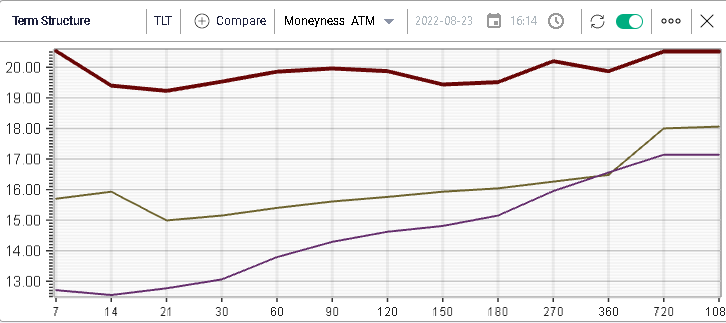
Options traders have now continued (red line above) to push implied volatility higher with short dated options trading above 20% IV for TLT anticipating some movements on Friday with Powell’s speech at the Jackson Hole Economic Symposium.
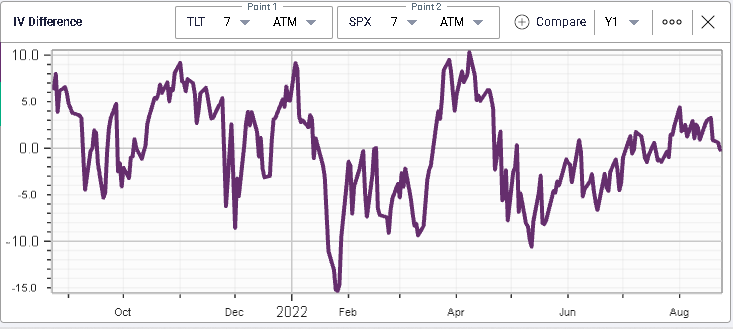
Looking at cross-asset comparisons, the 7 days TLT implied volatility trades flat to the SPX.
Across bond ETF implied volatilities most of the recent increase in implied volatility for weekly options was visible for long bonds where the market is still debating the sequencing of events as well as the terminal level of rates once the FED is done hiking.
This will matter greatly for all assets particularly for equities which have managed to live with the 10-year around 3% but might be at risk should long rates push much higher from there.
This is the reason why short dated options for the SPX have an implied volatility that has pretty much moved in lockstep with short dated options for TLT over the past few months. When the fixed income market speaks, equity traders listen.