Strong bounce for Chinese stocks
August 26, 2022
As traders expect the speech by FED Powell, the attention seemed to turn on the slightly more dovish rhetoric out of the few FED speakers that took stage yesterday. The USD was weak, Stocks rallied and 10-year yields dropped. The SPX finished 1.4% higher, the NDX 1.75% and the DJIA around 1%.
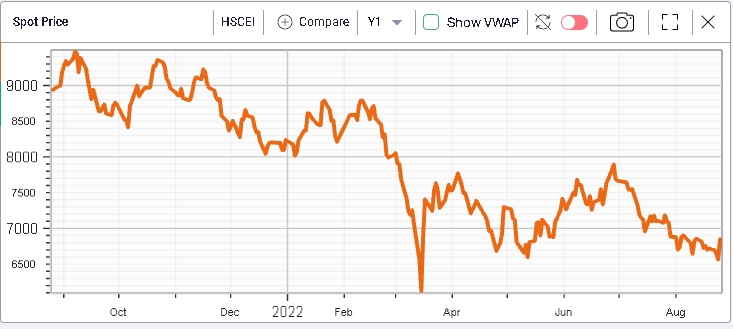
Chinese Equities performed very strongly gaining more than 4% over the session. The HSCEI pictured below has so far managed to hold its June lows. Media reports indicated that regulators were making progress in talks to avoid the delisting of Chinese companies listed in the US.
That specific risk of delisting seemed to have weighted heavily on Chinese stocks listed in the US although not all names have been treated equally as shown below.
BABA has lost around 17% in 2022 and almost 40% over the past year.

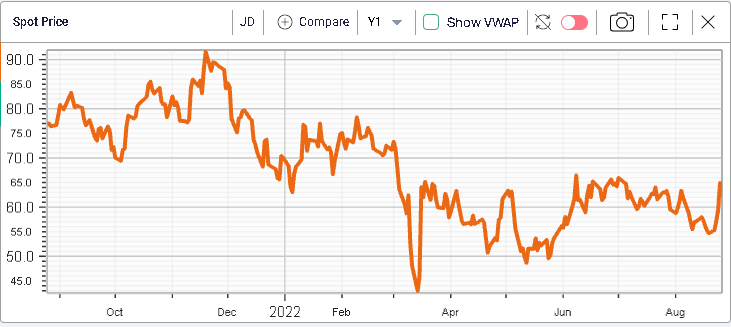
JD has fared better dropping only 5% in 2022 and losing "only" 16% over the past 12 months.
NTES has lost 8.4% in 2022 but is unchanged over the past 12 months.

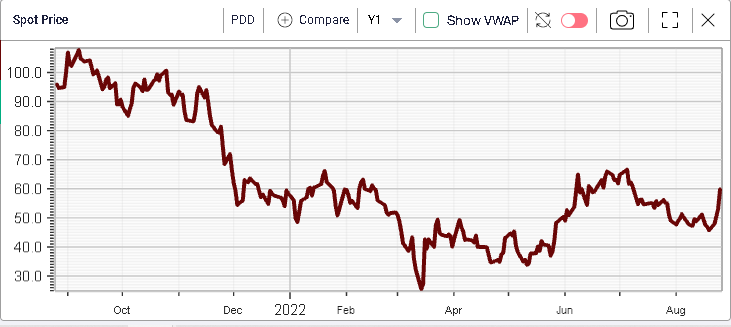
PDD has managed to gain 6.7% over the year but is still 38% lower over the past 12 months.
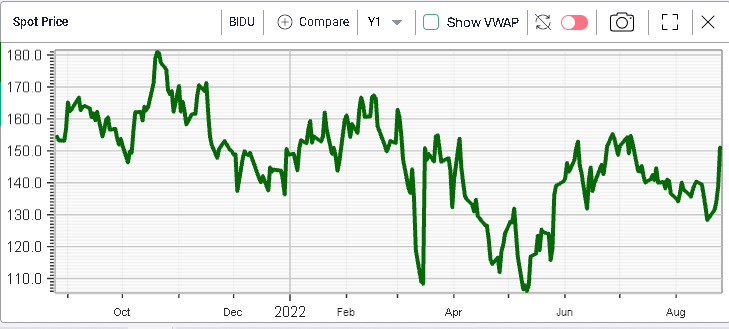
Finally, BIDU has gained around 1.3% in 2022 and is only 2% lower over one year.
Concerns about China are not limited to the delisting of Chinese stocks but also incorporate worries about the state of the economy with worries that the zero COVID policy might continue to weight on economic growth. The regulatory uncertainty remains elevated and concerns about the property sector are still present according to various media reports.
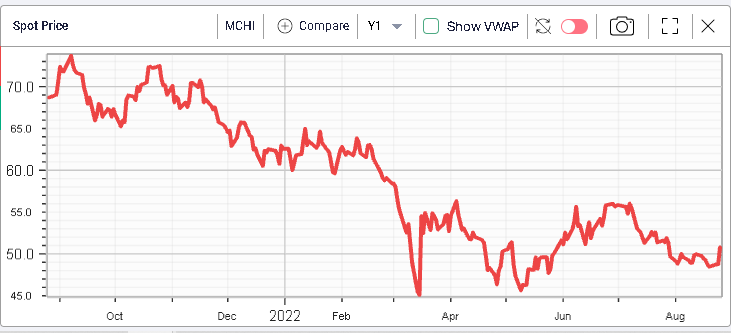
Looking at MCHI, an iShares ETF tracking the MSCI China index, it is around 19% lower in 2022 and down about 26% over the past year.
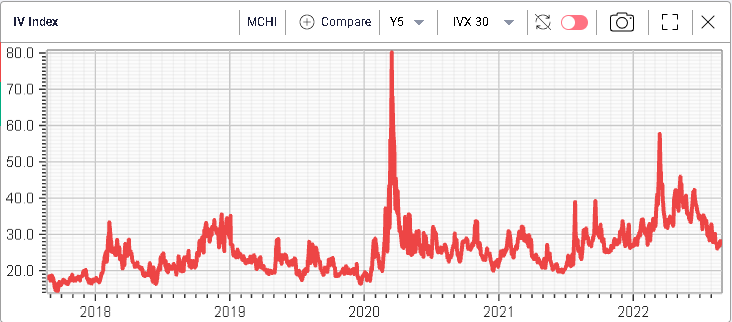
Looking at implied volatility it has dropped meaningfully over the past few months, in line with global indices.
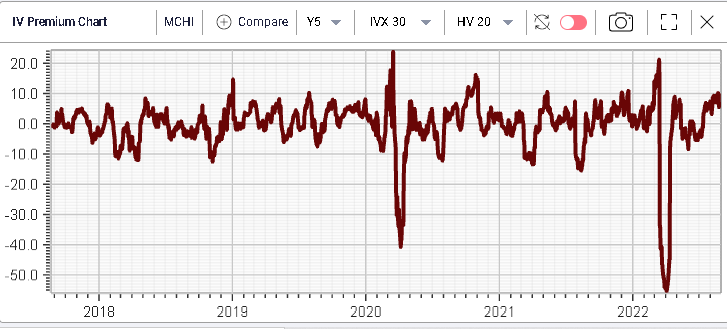
Despite this, realized volatility has dropped at an even faster rate and the IV Premium is now around 10% which is one of the highest levels over the past 5 years for implied volatility relatively to historical volatility.
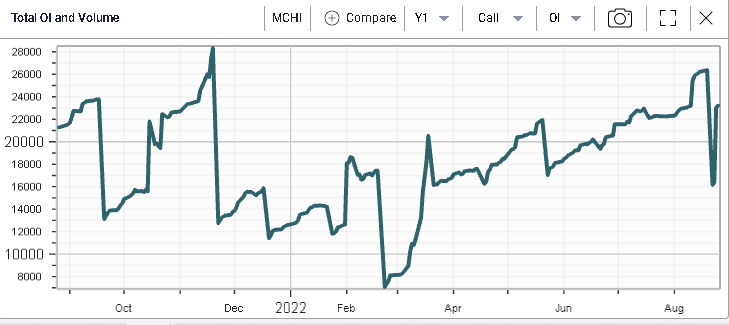
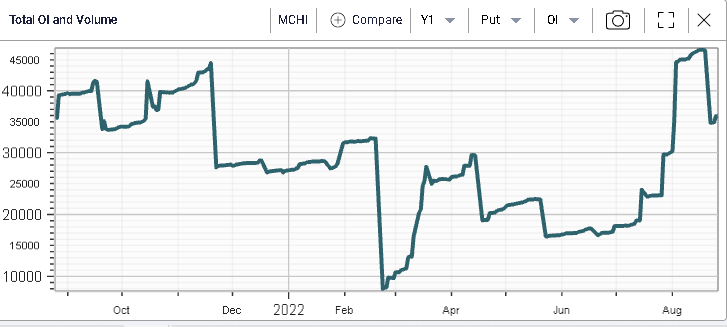
Looking at the volumes across calls and puts, they have been increasing over the past few weeks.
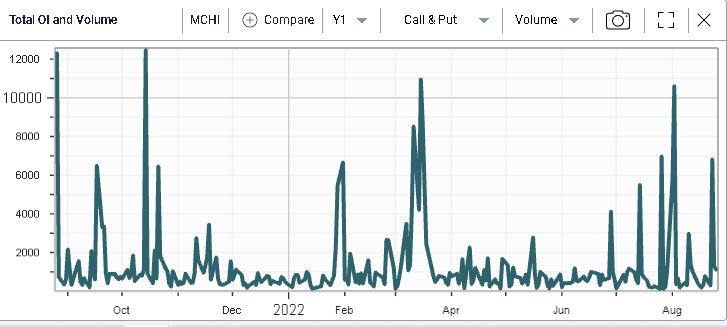
There seems to have been a buildup in call open interest as well as put open interest as evidenced in the charts below.
Looking at the RT Spread Scanner, one strategy that screens relatively well according to the scanner is a short bear vertical spread on MCHI.
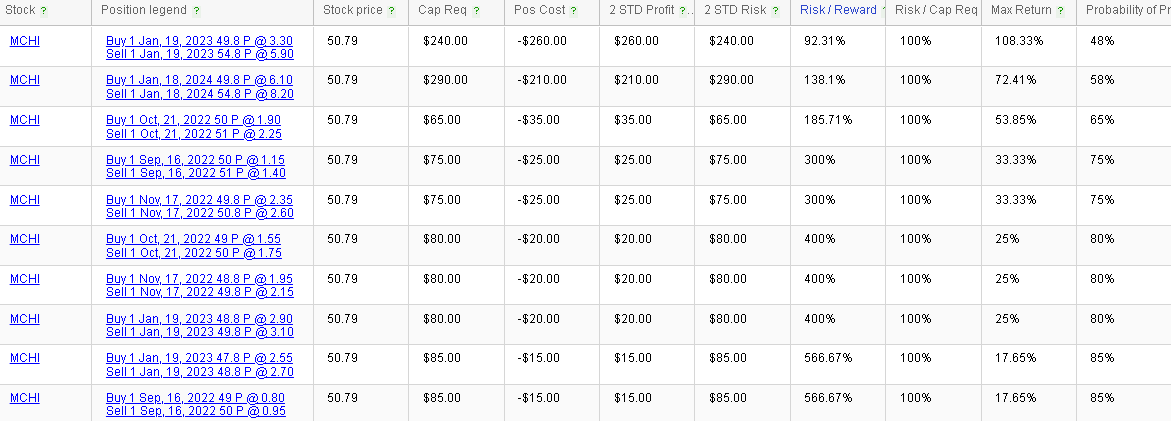
For instance, the first strategy presented here is an in the money bear vertical spread for a credit of $260 and a risk of $240.