Traders move to hedge market risk
August 29, 2022
Following the expiration on the 19th Aug’22, it felt like the market had started to struggle a bit more with the selloff on Monday taking 3 days to be filled before Friday’s very large move lower. 4300 proved to be a very strong resistance in the short run.
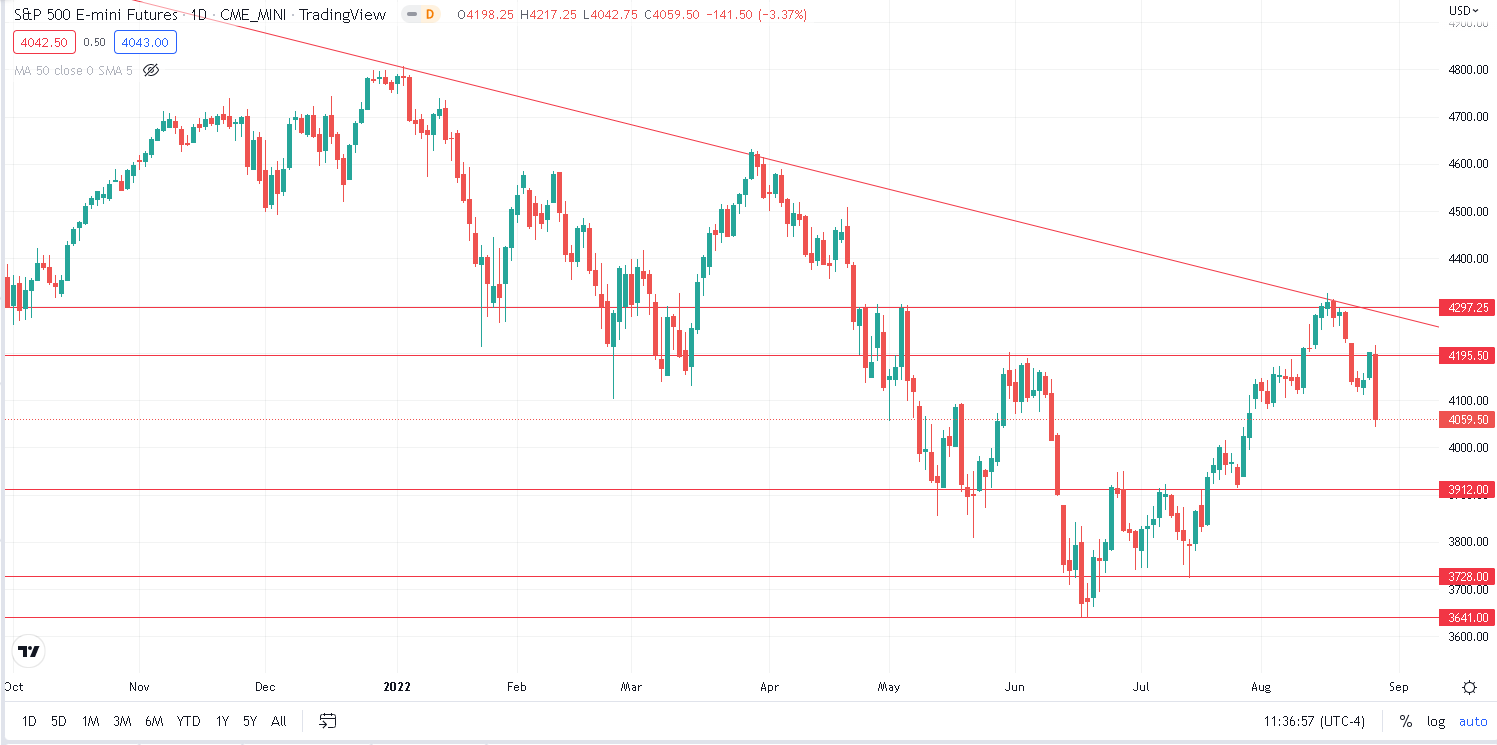
Source: Tradingview.com
Throughout the week, it did feel like the market was struggling to find a direction with prices hovering around with very little care for technical levels.
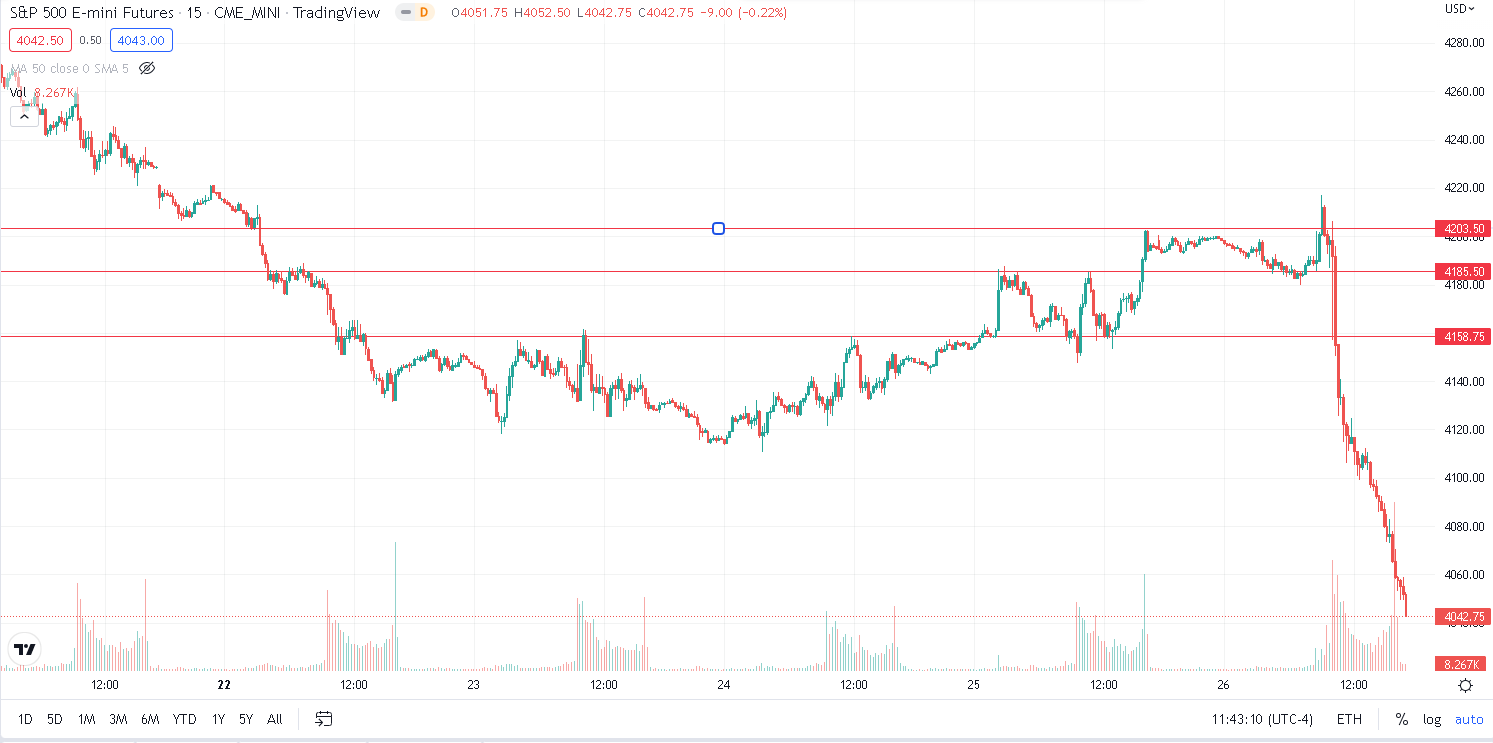
Source: Tradingview.com
Friday’s speech by FED President Powell was the trigger for bears to mobilize and start attacking the market again and the resulting effect was quite devastating. 141 points for the SPX (-3.37%), 538 points for the NDX (-4.1%) and 1008 points for the DJIA (-3.03%) of constant selling that left indices settle at the low point of the day going into the week-end.
The hourly chart provides some clues about the importance of this price action for the major US indices. The sequence of higher lows and higher highs that had been in place since the middle of Jun’22 was ended on Friday as seen below for SPX Futures.
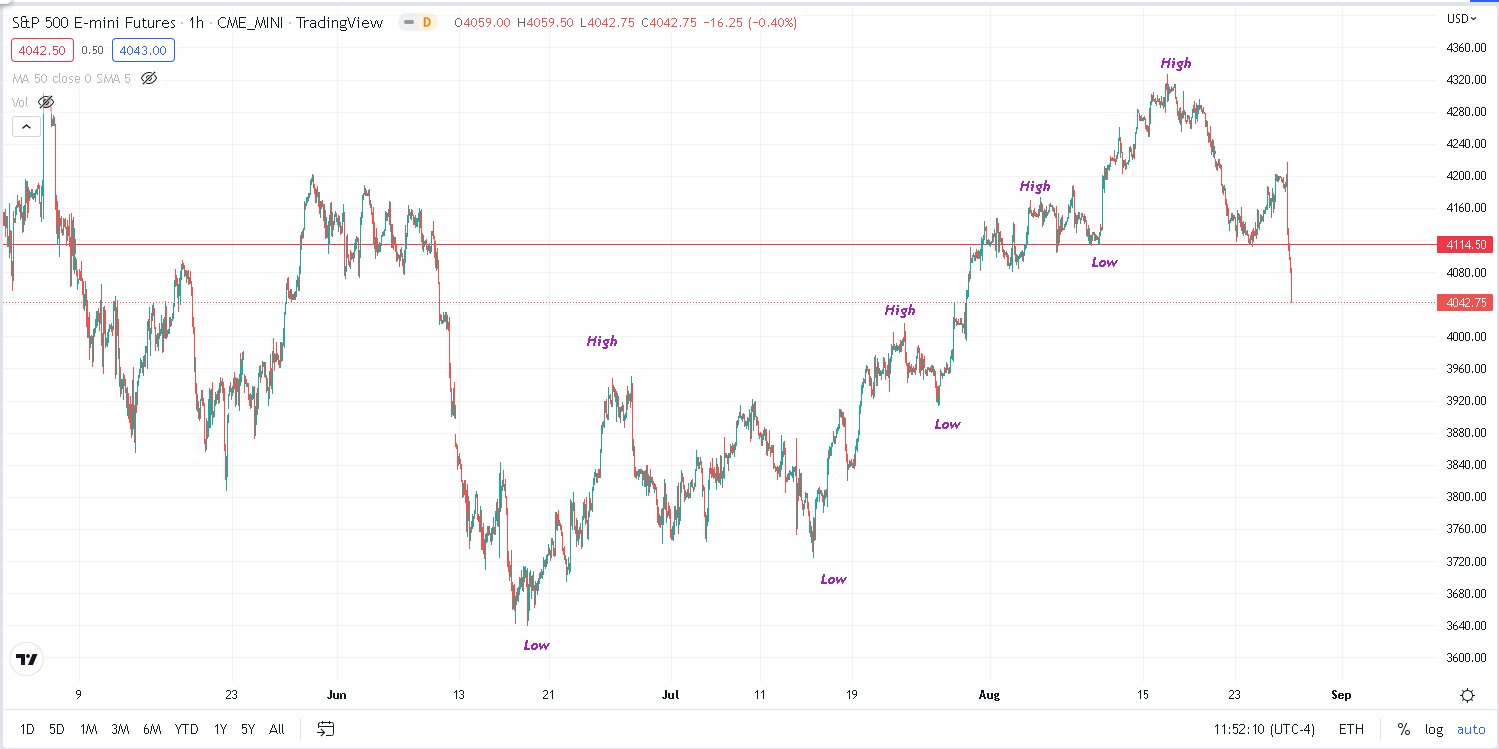
Source: Tradingview.com
The same is visible for the NDX Futures which were already showing some very strong signs of weakness by the middle of the week.
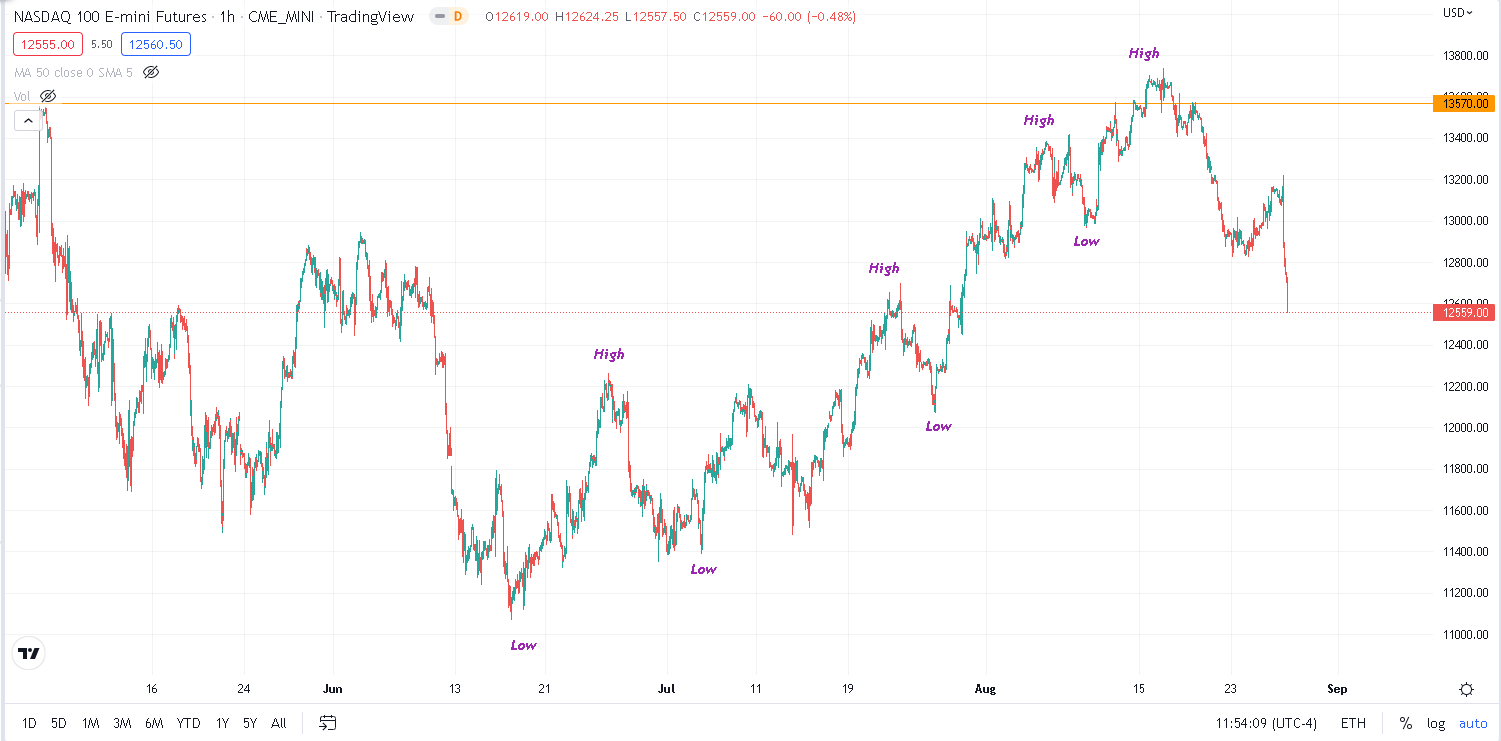
Source: Tradingview.com
Looking at media reports, it is clear that Powell pushed back very aggressively on the dovish read that had become the dominant narrative over the past couple of months. One of the dominant ideas that many FED participants seem to reject is the notion that the FED might have to cut interest rates rapidly after ending the hiking cycle.
Market participants had seemingly assumed that in order to squash inflation, the FED would most likely end up tipping the US economy into recession. As a result, some participants argued that the FED would then need to cut rates to support the economy again and avoid a long period of struggling economic growth.
Over the week, the SPX, the DJIA both lost around 4% and the NDX almost finished 5% lower. European indices were also under pressure with the French CAC closing the week 3.5% and the German DAX 4% lower, in sympathy with US stock indices and as the energy situation does not seem to abate. The EURUSD FX pair spent most of the week under parity.
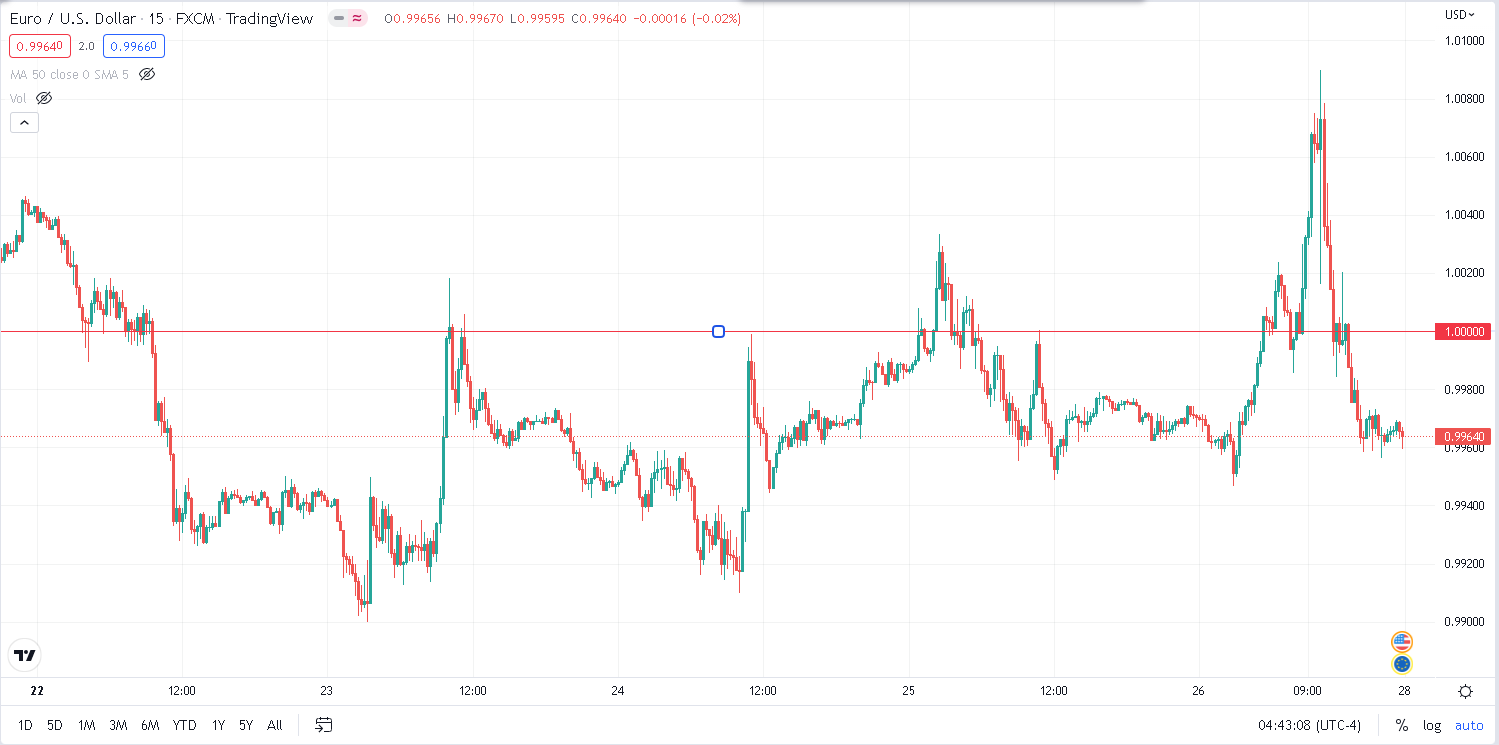
Source: Tradingview.com
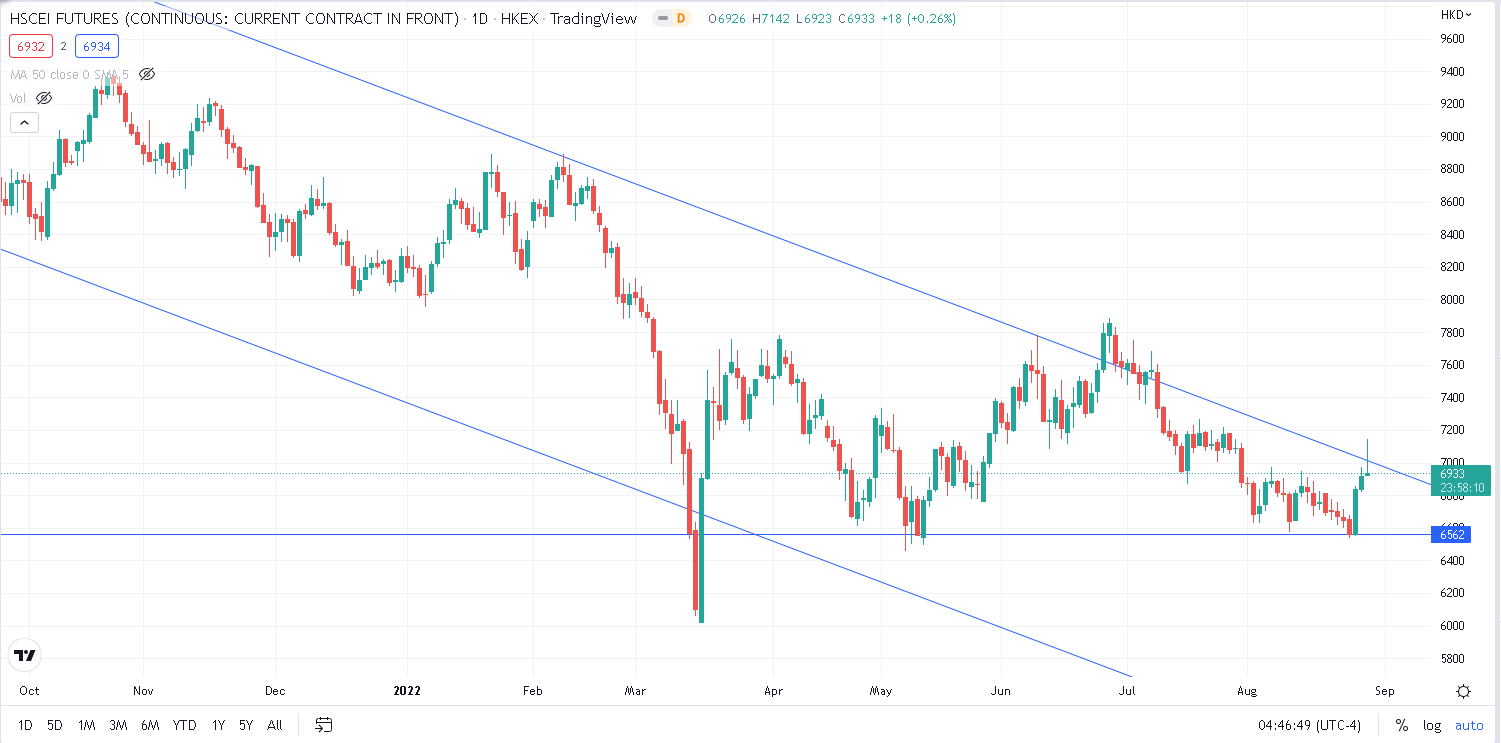
Asian indices performed slightly better mostly driven by Chinese stocks with the HSCEI finishing the week almost 3% higher.
Bulls attempted to push prices out of the downtrend that has dominated the index for the past 18 months but the selloff in the US session saw HSCEI Futures reject the break.
Looking at the sector performance over the week, the Energy segment was the only one that managed to show some gains over the week ending more than 4% in the green. Safer sectors fared slightly better, materials finishing around 1.8% lower on the week, utilities retreating around 2.2%. Despite finishing lower, those segments looked good when compared with Technology stocks which finished almost 6% lower or Consumer Discretionary which lost 4.5% over the week.
Looking at the DJIA components, we find a fairly similar picture with all names but two finishing in the red over the week. On the upside, CVX managed to gain around 4% and BA continued its bounce gaining around 1% on the week.
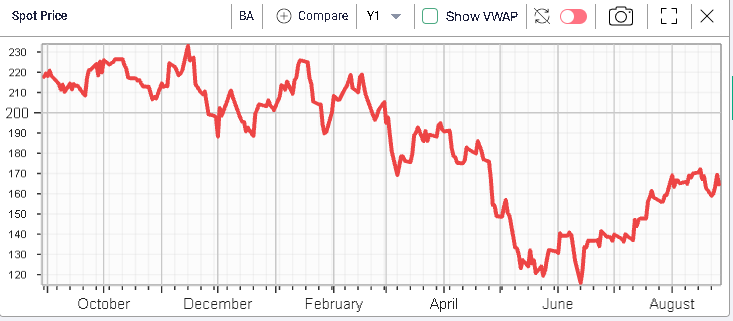
Looking at the above, we can see how far BA has come since the mid-June lows with a more than 40% bounce.
The worst performing stock for the DJIA last week was MMM which dropped almost 12% and is now back to its 2022 lows and very close to the lows reached in 2020.
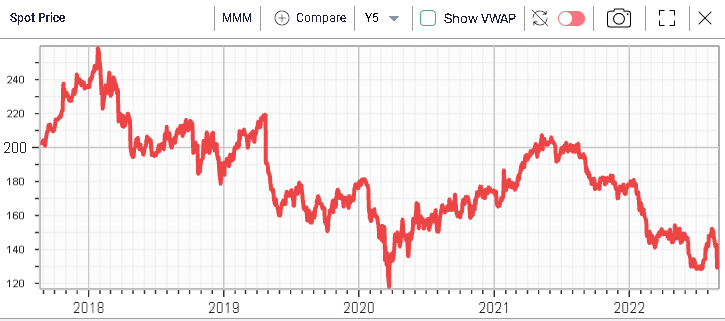
According to media reports, the company is in the midst of a legal battle surrounding one of its subsidiaries.
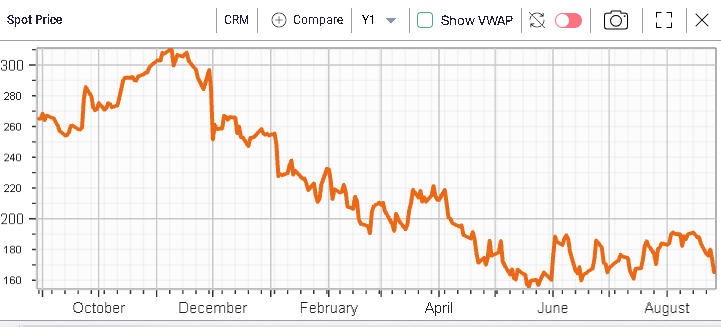
CRM also struggled over the week losing more than 10%. Media reports blamed the underperformance on the guidance provided by the company despite a beat of expectations at its most recent earnings.
The rest of the stocks displayed a surprisingly close performance, which on average was a drop of around 6% over the week. This is interesting as it shows that the price action may have been driven by Futures selling and traders trying to hedge their market risk as quickly as possible in the face of rising volatility.
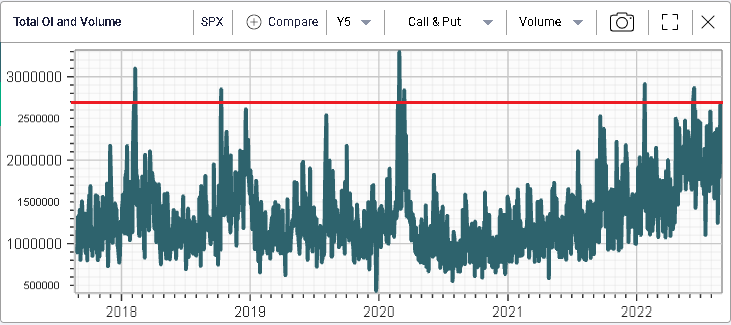
Calls and puts volumes were higher than usual on Friday as shown on the below with more than 2.66m contracts trading on Friday alone.
Futures’ volumes were also higher than on average as seen below.
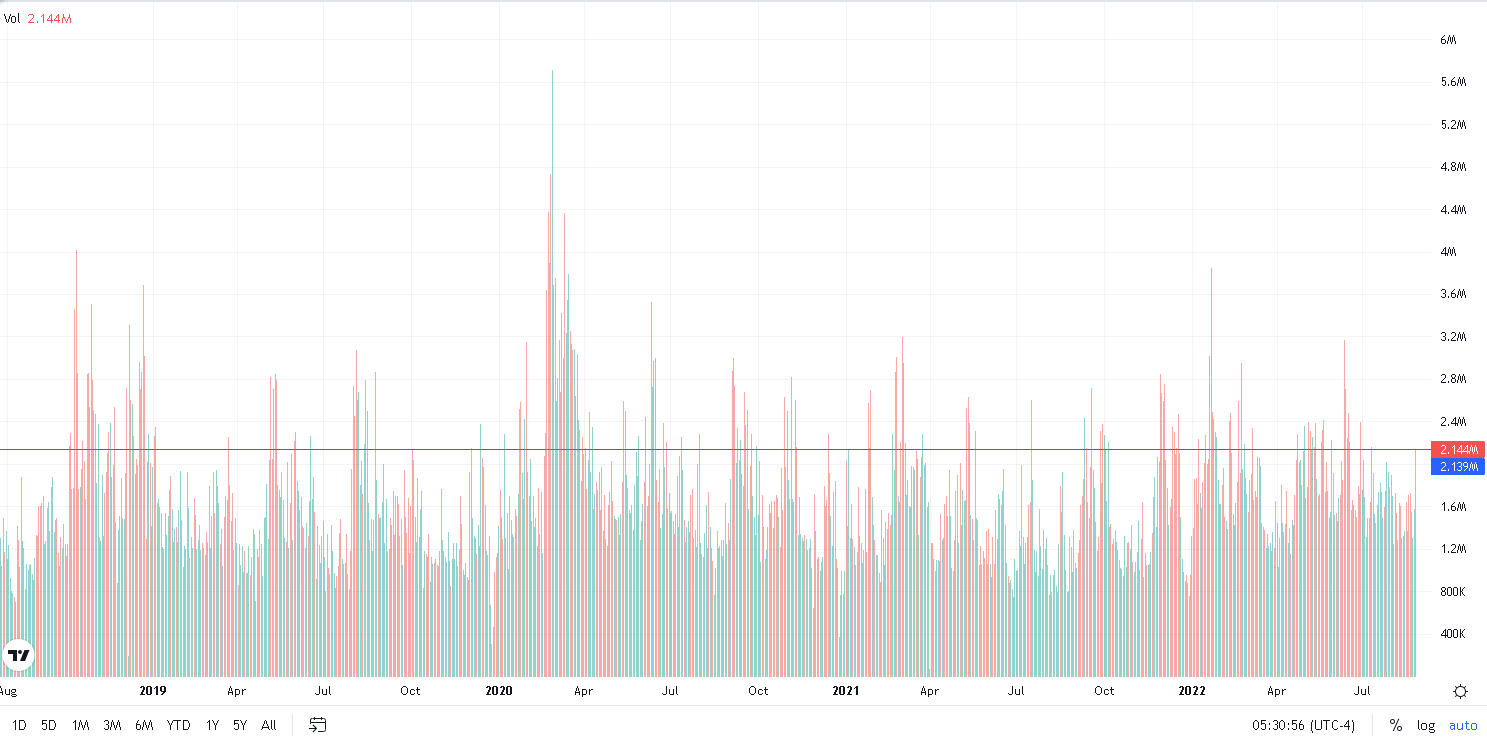
Source: Tradingview.com