Option holders nervousness increasing
September 1, 2022
The current selloff is probably of the worst kind for options traders. As indices drift lower without much impetus, put holders find themselves barely profitable despite having the correct view.
Yesterday, the SPX lost 0.78%, the NDX 0.57% ad the DJIA 0.88%. This phenomenon is best explained by looking at the below charts showing the SPX intraday spot prices alongside the 30d IVX throughout the session.
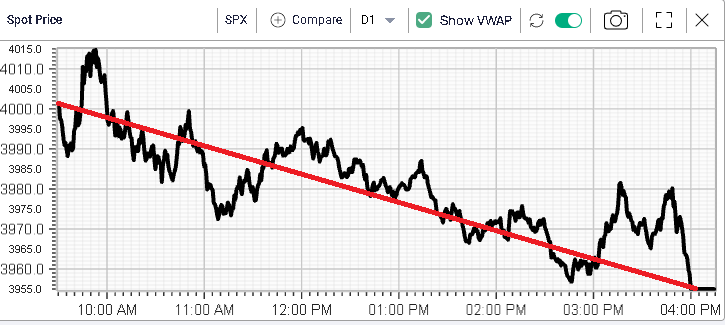
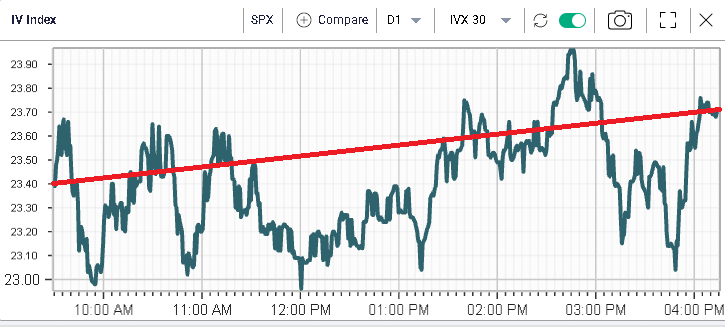
Linking the open print for the SPX spot and 30d IVX, we can see that while spot went down around 45 points open to close, the 30d IVX moved higher by a mere 0.3 points.
In practical terms, we show below the change in value for the Sep’22 puts with strike listed below. We can see that a trader who bought on Tuesday evening the 3500 puts, despite the stock moving lower, would have lost money.
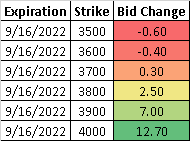
The higher up options (3900 & 4000) have managed to increase in value as they are more sensitive to changes in spot price but this also shows that holding a bear vertical spread in the current environment would have been a winning strategy as the long leg would have gained while the short leg would have lost in value giving a gain on both sides for the trader.
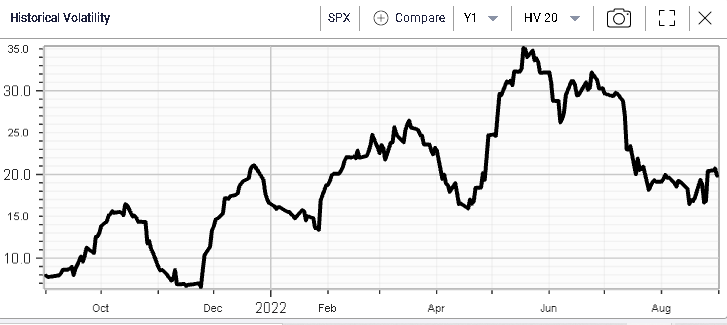
The trouble for outright put holders can be summed up by the below charts showing the IVX 30 increasing at the same time as the historical volatility is left sideways.
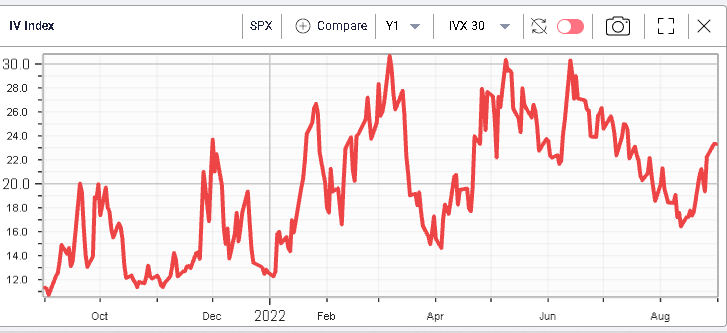
This is best summed up by the below chart, IV Premium displaying the difference between the 30d IVX and the 20d HV.
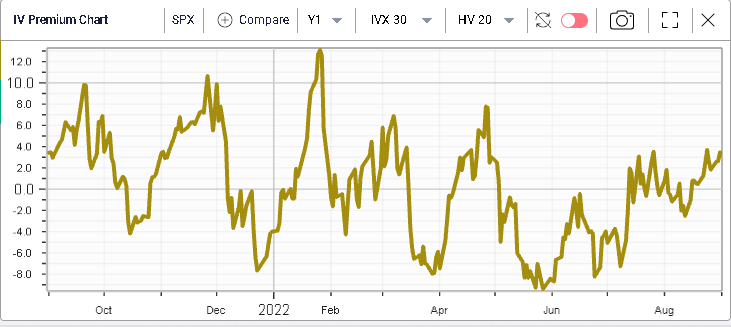
The premium is mechanically increasing and that will most likely leave long outright holders nervous.