A look into MMM’s selloff
September 7, 2022
The low subdued realized volatility regime seems to continue for now with the SPX dropping 0.41% after the long-weekend, the NDX losing 0.72% and the DJIA finishing 0.55% lower.
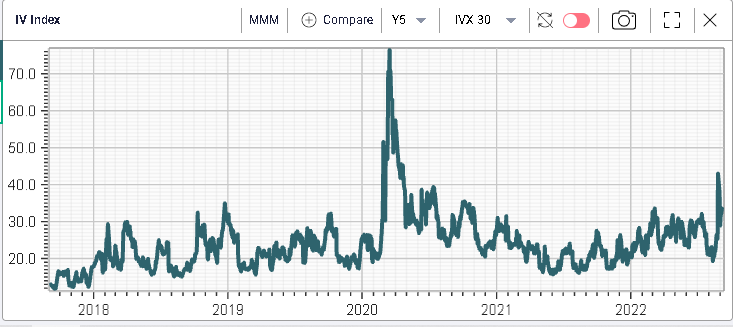
Looking at implied volatility, it increased by slightly more than 1 point for 30d NDX options as seen below.
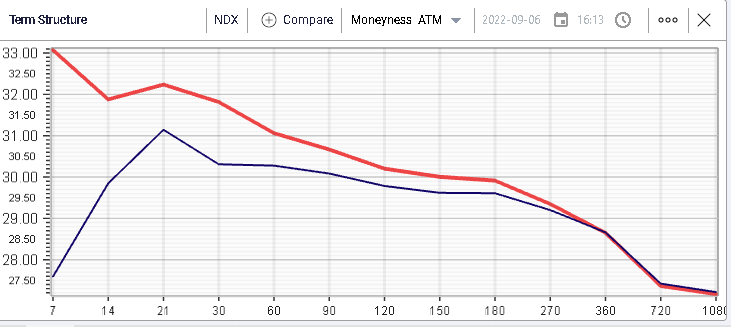
Since the August expiration, 30d IVX for the NDX has gained around 9 points, and continues to drift higher.

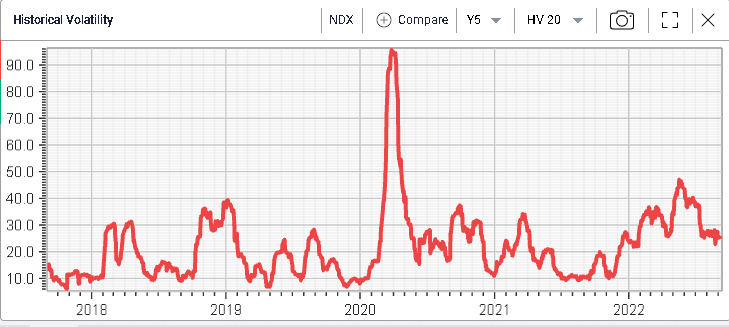
This has happened despite the fact that HV has remained subdued as seen below.
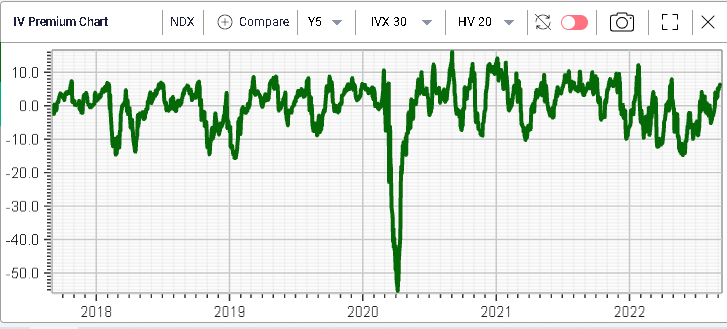
As a result, the IV premium (30d IV vs 20d HV) has drifted back towards its recent highs of +10 and is now established around +6.4.
Looking at single stocks for Tuesday’s session, things look pretty quiet although within the DJIA components, MMM struggled losing more than 4% over the day as media reported a new lawsuit related to the spinoff of its healthcare business (source: Reuters).
The stock broke its 5 years lows closing at $116.6 against a pandemic low of $117.87.
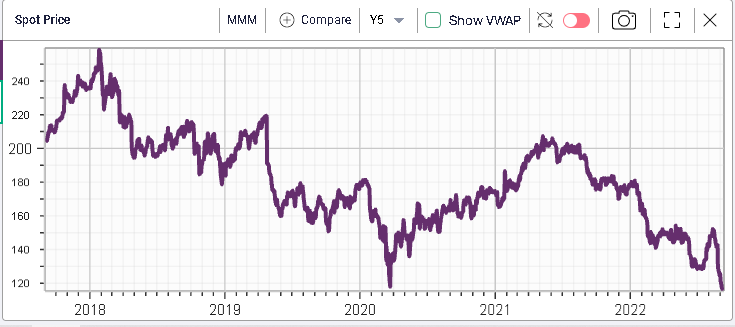
While implied volatility in the name has increased, it remains far off the highs seen in 2020 as seen below.
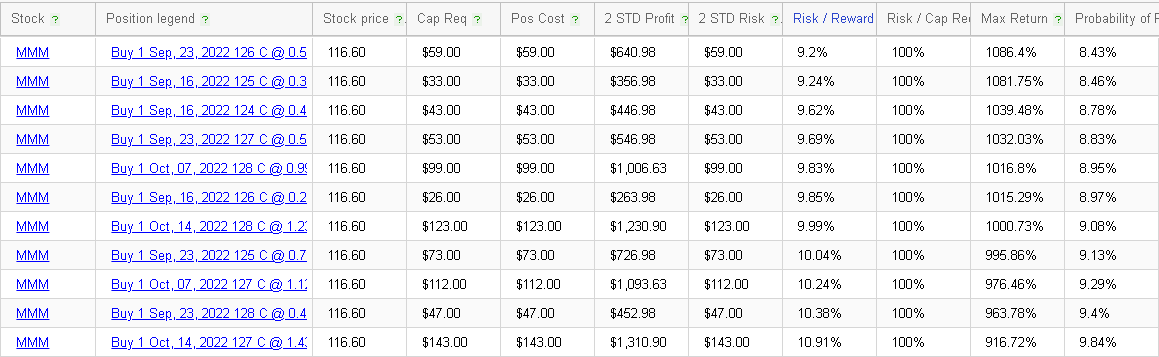
Using the RT Spread Scanner, we can search for the best structures to either express a bullish opinion or a bearish one on the name.
For instance, on the bullish front, looking for naked calls returns the following list with a focus on short-dated options offering the best risk/reward. For instance, the 23rd Sep’22 - 126 calls worth $0.5 offer a 9.2% risk to reward ratio. In other words, for every $9c of risk, the trader stands to make $1 of potential profit.
On the downside, we look at naked puts and get the following list:
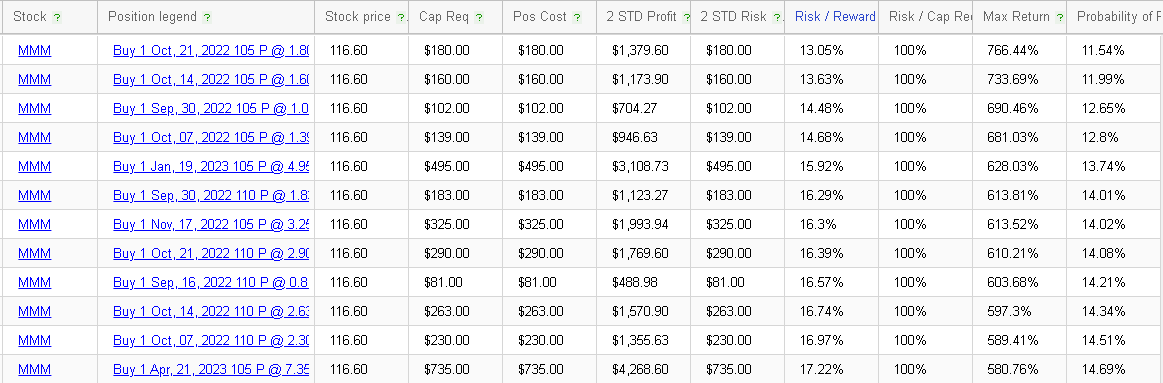
Here the best opportunities seem to be for slightly longer dated options with 21st Oct’22 - 105 puts at $1.8 offering a 13.05% risk to reward ratio.