DOCU earnings, Utilities rally and Energy stocks outperform Crude Oil
September 8, 2022
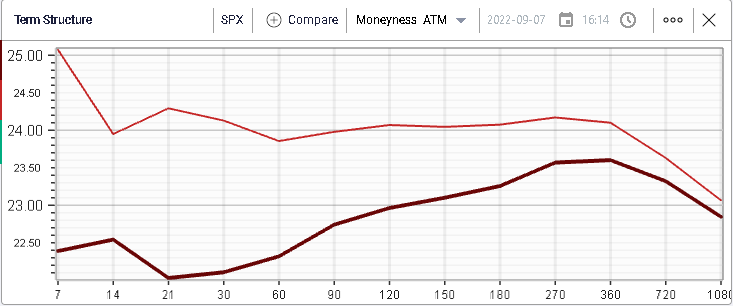
Markets turned around yesterday and rallied with the SPX gaining 1.83%, the NDX 2.07% and the DJIA 1.4%. As a result, implied volatilities dropped with 30 days losing around 1.5 points over the day.
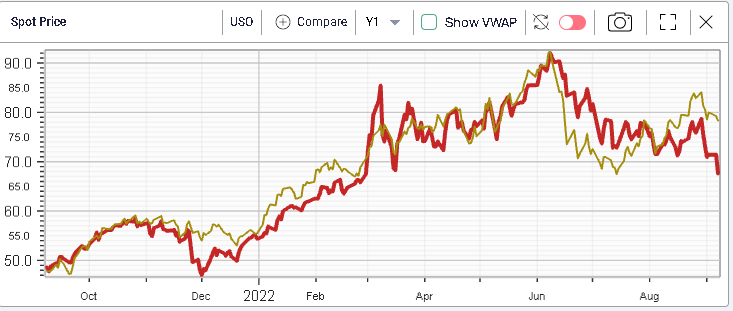
At the sector level, the energy segment struggled as Crude Oil dropped 5.3% during the US session. The XLE dropped 1.2% over the day.
The outperformance of Energy equities relative to Crude Oil (measured with USO here) is quite interesting. In the below, we display in red the ETF USO and in yellow the XLE, the ETF tracking energy equities.
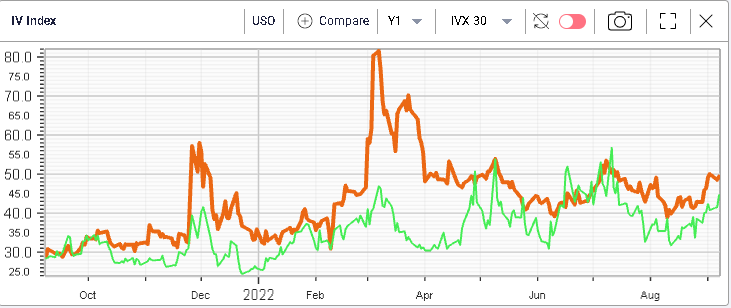
This spot price divergence does not translate into a volatility divergence as seen below with USO 30d IVX in orange and XLE 30d IVX in green.
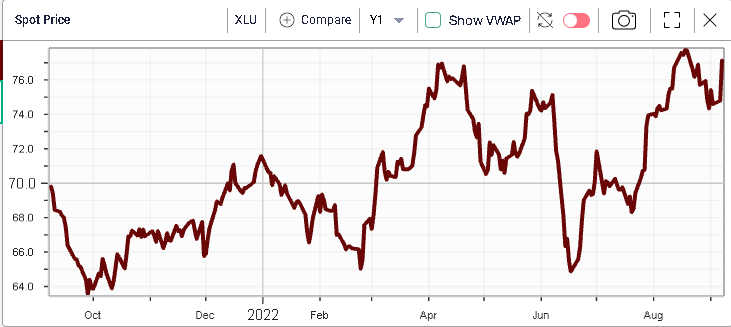
Utilities gained more than 3% over the day displaying the best performance for Wednesday’s session trailed by Consumer Discretionary stocks that also gained more than 3% over the day.
Utilities have played their defensive role fully this year and are now approaching 12 months highs with a gain of almost 9% YTD.
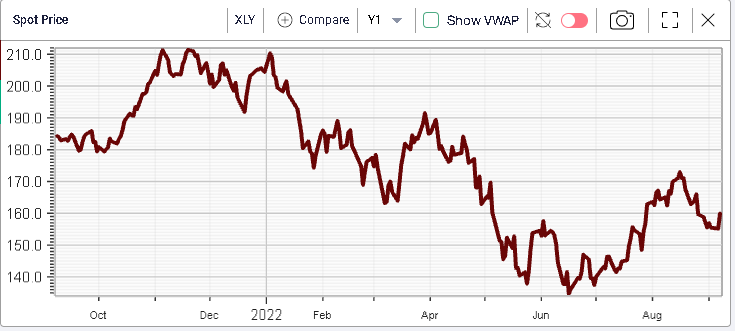
Consumer Discretionary stocks on the other hand remain under water in 2022 (-24%) although they have rallied a decent amount from their June lows.
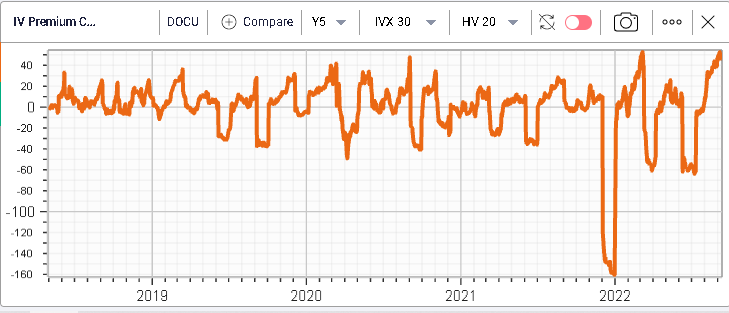
Looking at stocks that are expected to be in play over the next month, we can flag DOCU which has lost around 65% so far in 2022.
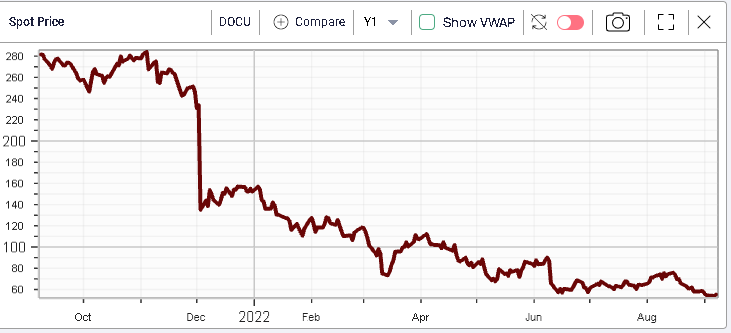
Implied volatility in the name is pretty much at 12 months high while the realized has remained subdued.
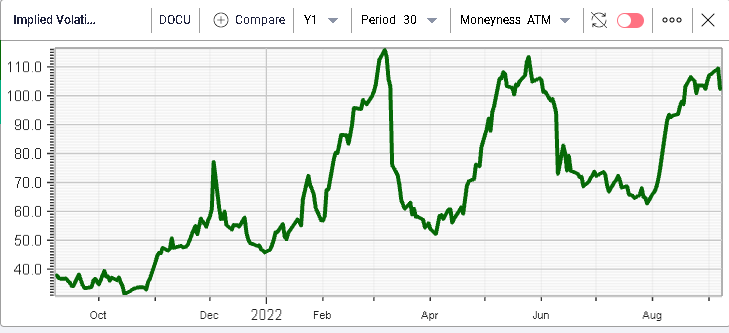
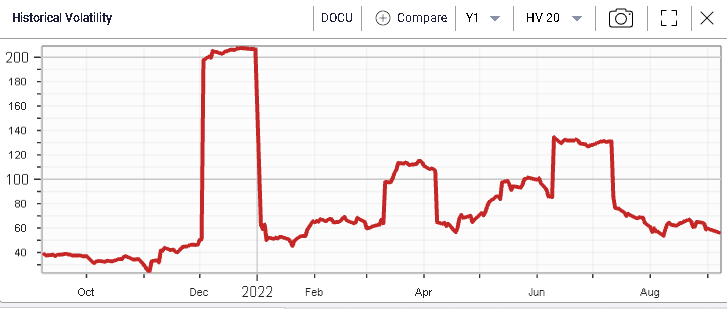
This leaves the IV Premium (30d IV vs 20d HV) at its highest level ever at +52.7.
The company is due to release its results today after the market closes which will grab the attention of many traders and ivnestors.