Very rare spot / vol convergence yesterday
September 13, 2022
As we discussed in yesterday’s market update, the buying pressure that emerged on Friday was fairly significant with the DJIA returning a full house over last week (i.e., all stocks ended up in the green). The strength continued yesterday with the SPX finishing around 1% higher, the NDX gaining 1.2% and the DJIA closing 0.7% in the green.
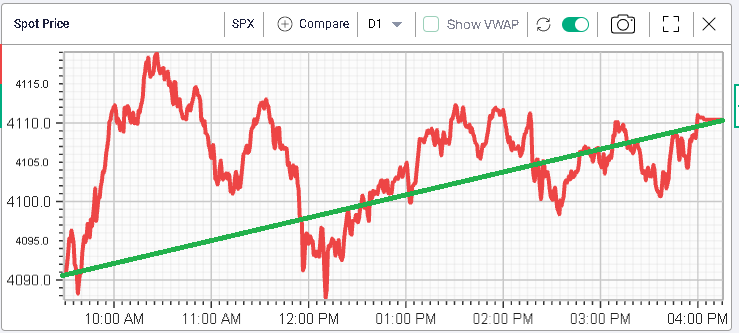
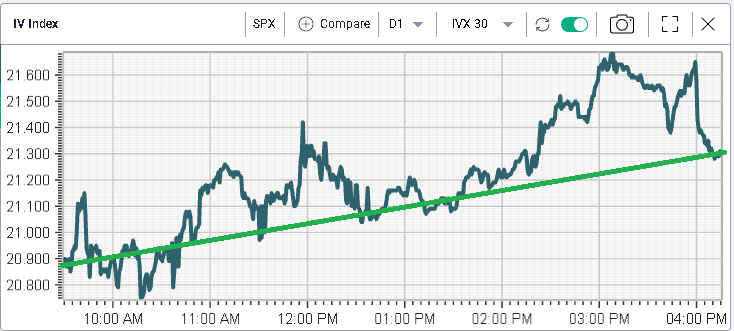
It was worth noting yesterday the divergence between spot prices and implied volatility with spot prices trending higher at the same time as implied volatility was moving higher.
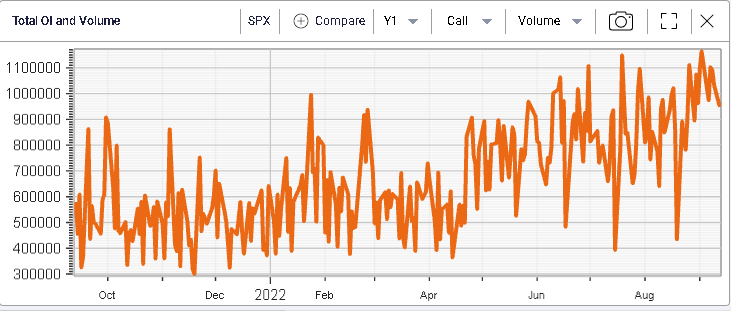
Call volumes have been slightly higher than historically over the past few weeks as seen below.
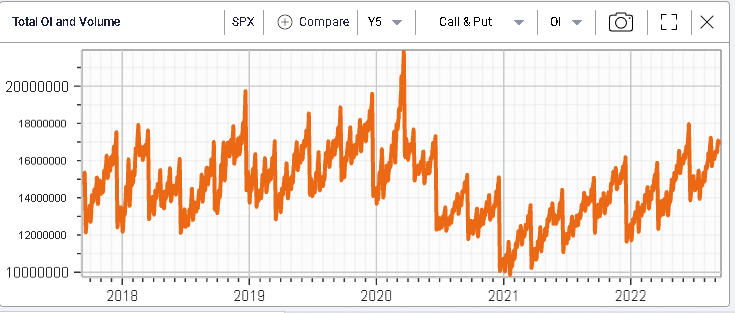
Looking further at the open interest, we can see that outstanding open positions are at their highest levels across puts and calls going into Friday’s expiration.
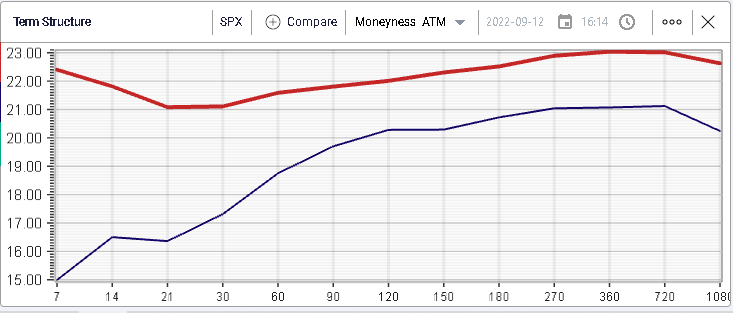
Since the August expiration, implied volatilities have remarked higher with 30d IVX moving 4 points higher for the SPX.
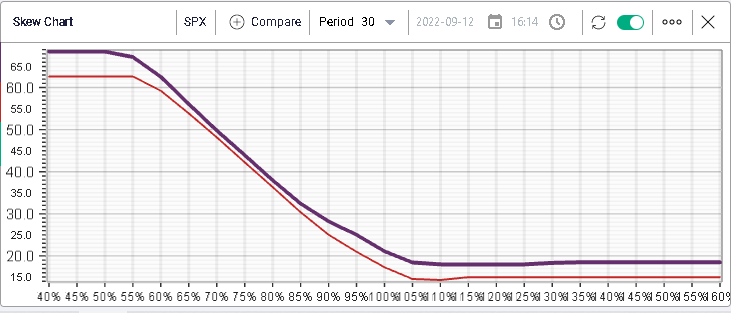
Looking at 30d skew, we can see on the below chart that the implied volatility for 30 days options has gone up mostly for strikes around the money and upside calls. On the other hand, implied volatility for downside puts has barely remarked higher.
The spot / vol divergence that was observed is a fairly rare occurrence especially considering the magnitude of the changes. Since Jan’18, there has been 106 days when spot and vol (measured with 30d IVX) were higher out of 1181 trading days for the SPX. That is around 9% of all the trading days studied.
Once we factor in the fact that yesterday saw spot move higher than 1% and 30d IVX move higher by 1 point, this has only happened 5 times since Jan’18 or 0.42% of the time.
One of those days was in March 2020 when the market then rallied 13.2% and IV dropped 21.5 points but outside of this single event, the other three occasions resulted in a lower spot (on average 4%) and a higher 30d IVX by around 5.5 points.