Traders caught by surprise, put volumes run high
September 14, 2022
Very heavy day for stocks yesterday following the CPI release. Over Friday and Monday, it felt like the market sentiment was turning more bullish going into the figures with the notion that inflation was to cool down.
Unfortunately, the reality turned out to be very different with an inflation number that came at +8.3% higher than anticipated by the market.
This triggered an immediate repricing of Fixed Income assets with the attention for next week’s FOMC meeting shifting from whether the FED would deliver 0.5% or 0.75% to whether it might actually have to raise by a full percentage point.
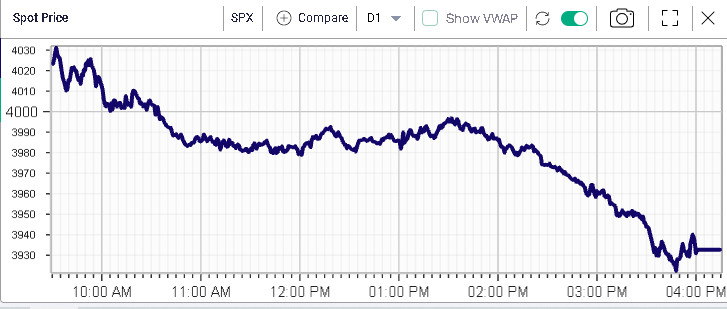
The selling that ensued for stocks was relentless and indices had their worst session since 2020. SPX finished 4.3% lower, the NDX 5.54% lower and the DJIA was 4% lower by the close.
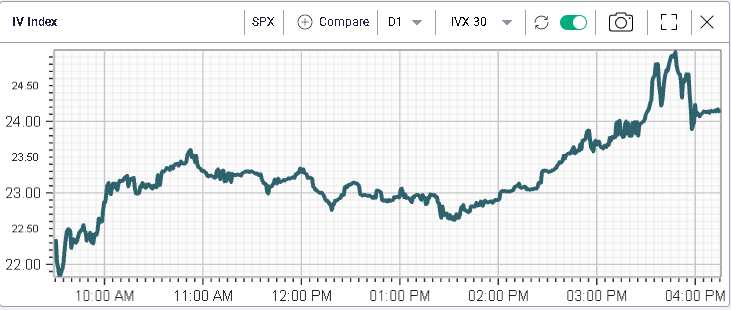
On Monday we flagged the divergence between spot and volatility and without much surprise, yesterday saw the IVX 30 move higher by around 2 points.
At the sector level, Communication names lost 5.5% and Technology stocks dropped 5.3%. Consumer discretionary stocks also struggled losing 5.15%.
Defensives performed best with Utilities losing 2.6% and Healthcare dropping 3.3%. The Energy segment was the best performing sector over the session losing 2.5% as Crude Oil stabilized (-0.5%).
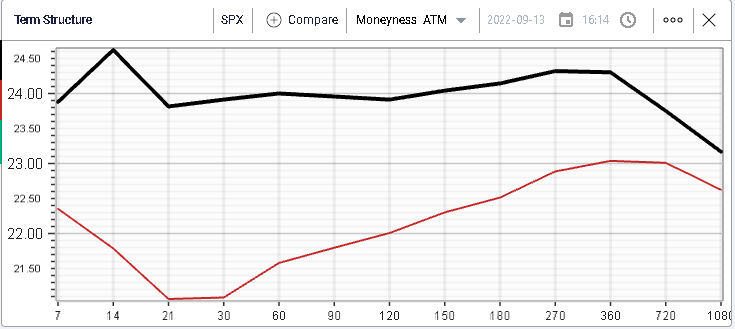
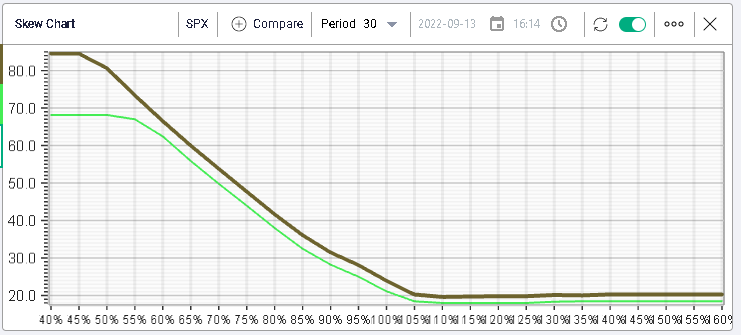
Looking at the term structure change over the session, we can see that the 1-month area was the most impacted with the volatility resetting higher of around 2.5 points.
Looking at skew changes, it seems that the downside puts were pushed higher by the greatest amount as market makers anticipate that demand for hedging might increase with such a violent price action.
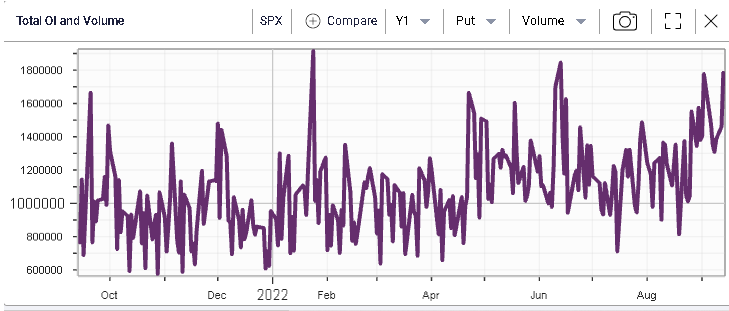
Looking at put volumes for the SPX, we can see that demand already started to increase with one of the largest volumes for puts over the past 12 months seen yesterday.
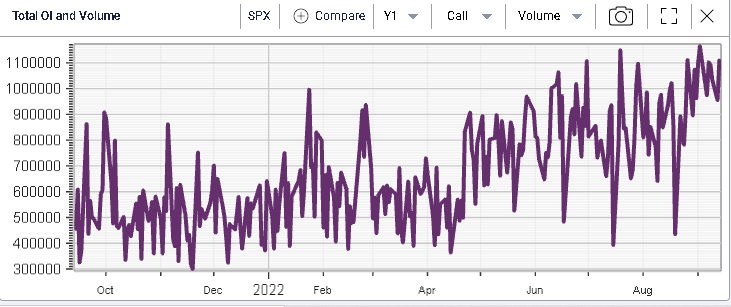
For calls as well, the volume has remained elevated as seen below.
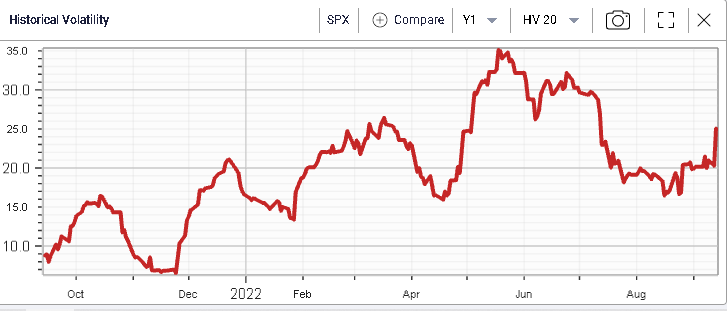
Finally, looking at realized volatility, yesterday’s move pushed 20d HV to its highest level in almost 2 months around 25% annualized.