Market stabilization and a rate cut in China
September 15, 2022
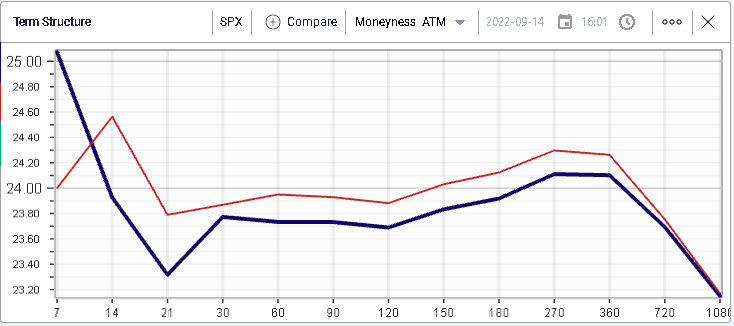
Markets stabilized yesterday and paused ahead of expiration tomorrow. The SPX settled 0.34% higher, the NDX 0.84% higher and the DJIA 0.1% higher.
Implied volatilities dropped slightly with 30d losing 0.2% over the session and flows remained elevated with more than 2.6 million contracts trading across calls and puts for the SPX.
Chinese growth is amongst the key themes being discussed in the market at the moment as the country continues to implement very strict anti-COVID policies and remains under pressure from the real estate sector. Media reported yesterday that Chinese banks cut their deposit rates for the first time since 2015 (FT).
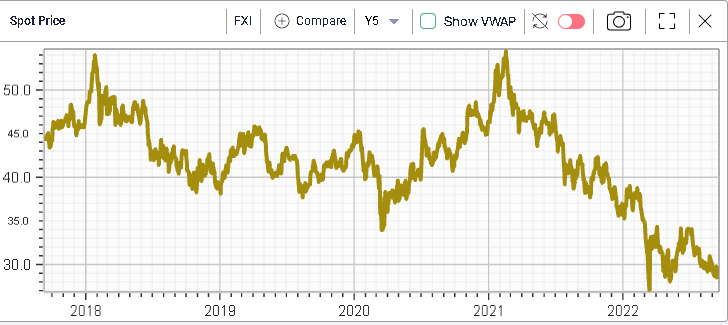
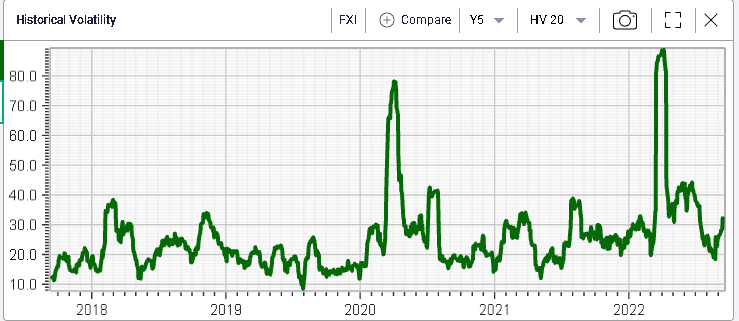
Looking at FXI, a Chinese ETF with Net assets around $5bln, it has lost around 36% of its value over the past 5 years.
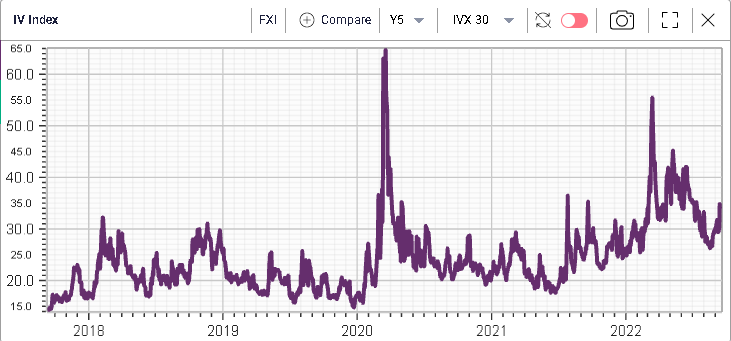
Implied volatility in the name has been drifting higher recently although it has been constrained by realized volatility which has been under pressure currently slightly above 30%.
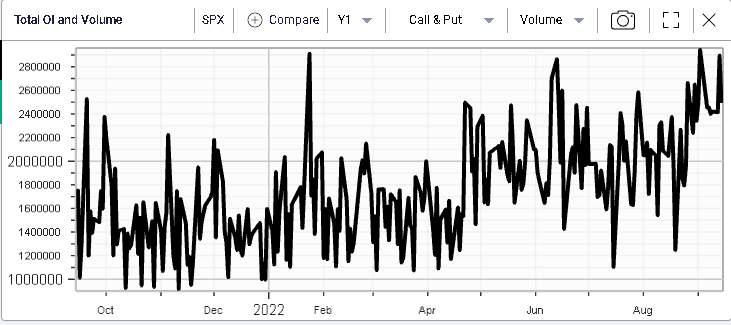
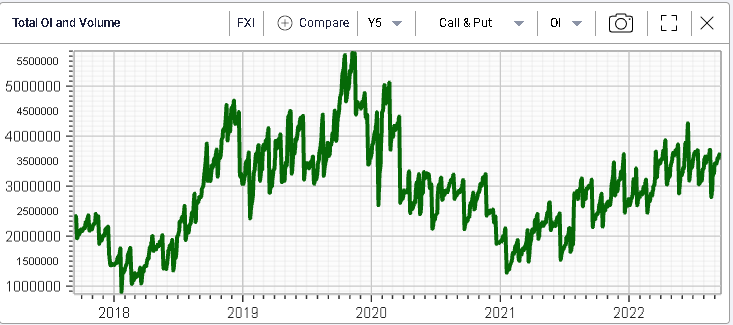
Looking at open interest, it has increased over the past few months, mostly driven by the call side.
Using the RT Spread Scanner, we can search for the most attractive bull vertical spreads and bear vertical spreads from a risk/reward perspective.
The system suggests looking at the following on the upside:
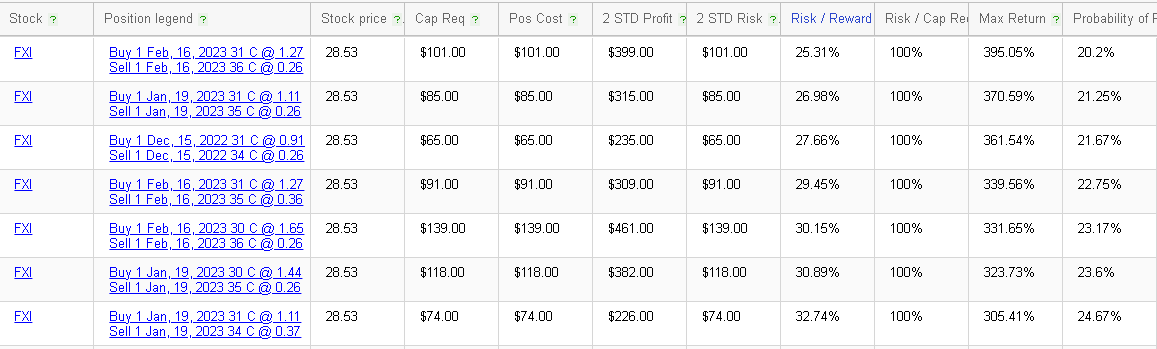
The Feb’23 31/36 bull vertical spreads screen as being the most attractive from a risk/reward perspective with a position cost of $101 and a potential 2STD profit of $399 giving it a R/R of 25%.
For bearish plays, the system returns the following possibilities for bear vertical spreads:

The most attractive alternative is to consider the Feb’23 25/18 bear vertical spread for a cost of $95 and a potential 2STD profit of $605 offering a R/R of 15.7%.