US Indices under pressure at key support
September 19, 2022
Last week saw a decent correction in Equity markets led by US indices with the NDX losing almost 6% over the week, the SPX dropping around 5% and the DJIA slightly more than 4%. Europe outperformed over the week with the German DAX finishing only around 2.5% lower and the French CAC losing around 2%.
Technically, ES remains in a downtrend, barely preserving the key support around 3900 on Friday after an intraday plunge to 3850. Next major levels on the downside are seen at 3740 and 3645 while on the upside the attention would turn towards the pivotal high of 4170.
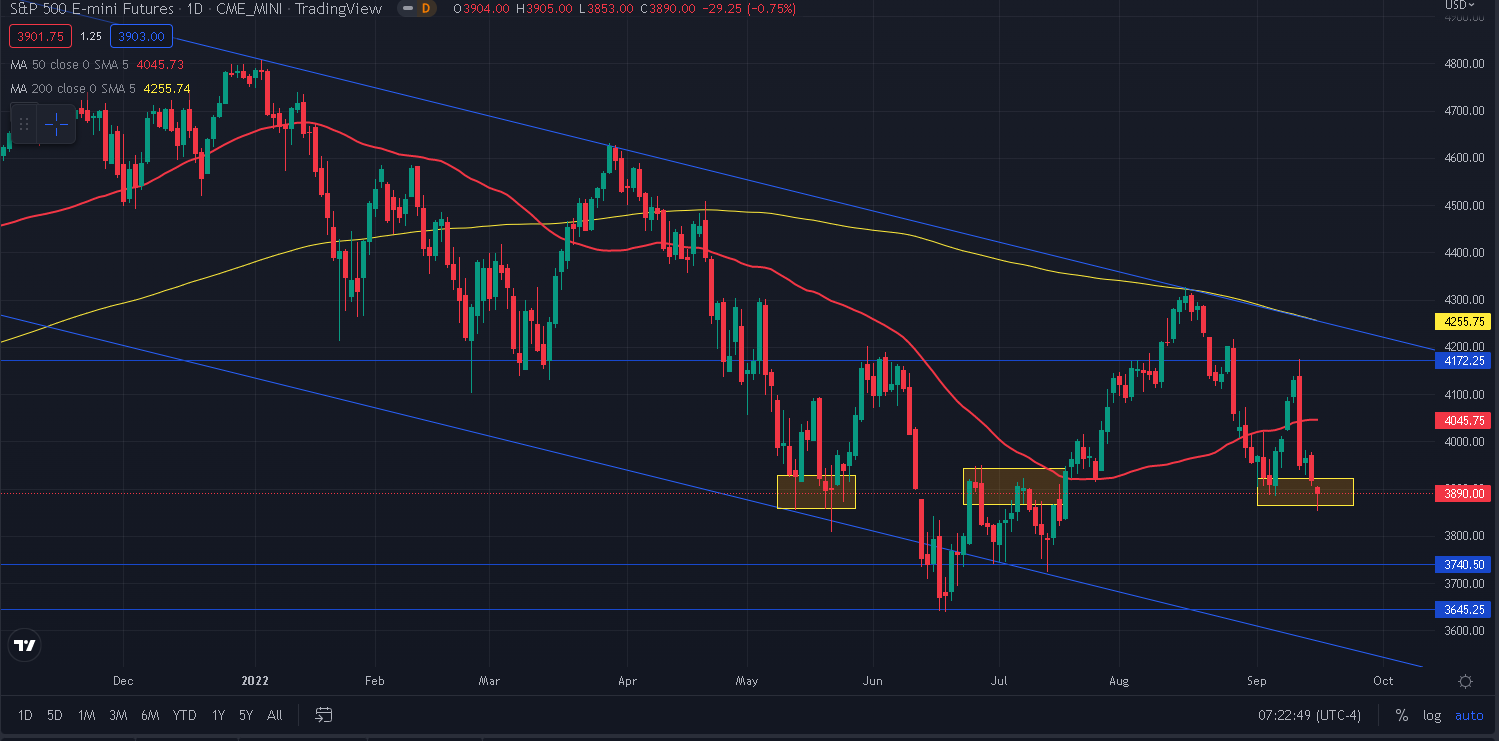
The 200 days moving average (in yellow above) is still moving in lockstep with the downtrend established by connecting the three major highs of 2022. Last week, the market also broke back below its 50 days moving after following Tuesday’s large move lower.
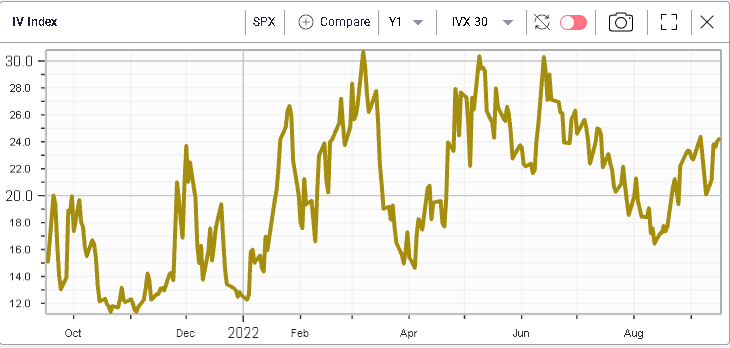
Implied volatility has moved higher over the week and the 30d IVX is now trading around 24.2% for the SPX.
The term structure chart below shows the increase in implied volatility over last week with weekly options gaining more than 7 points and 30 days options finishing around 4 points higher.
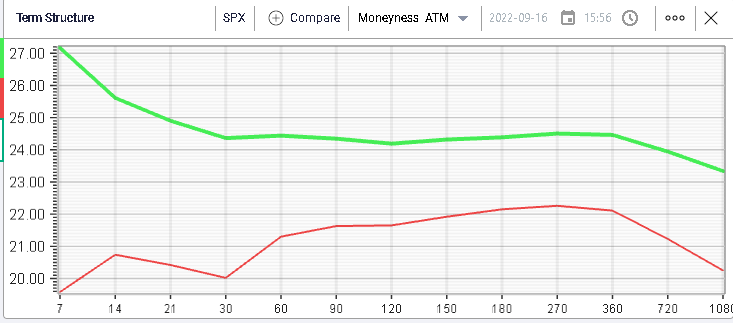
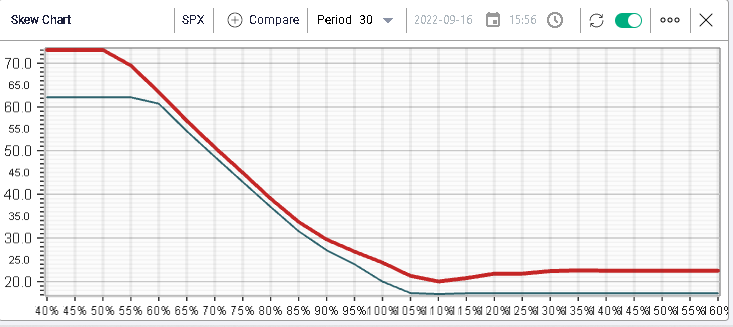
Looking at 30 days skew, we can see that downside put options underperformed from a volatility perspective and most of the move higher in IV was driven by at the money and upside options.
Putting this in historical context, we show below the difference between the implied volatility of the 95% put and the 105% call.
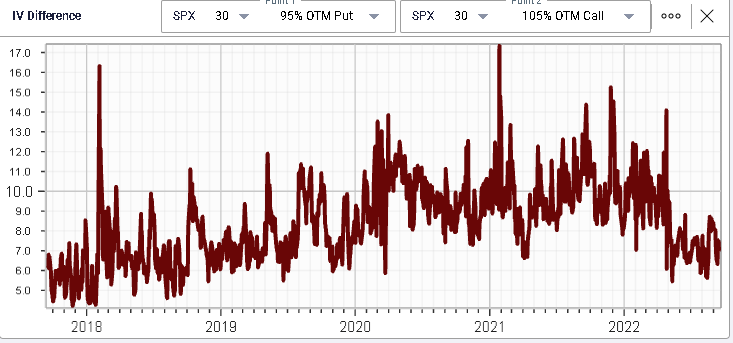
On the above chart, we see clearly that the difference has dropped to levels not seen in years with around 7 points of premium in the current environment for the 95% put IV relative to the 105% call IV.
Looking at sector performance over last week, we note that 4 segments of the market underperformed the broader index and drove performance down. Those are:
- Materials sector losing 6.62% over the week
- Communications losing 6.5%
- Technology stocks dropping 6.5%
- Industrials down 6.6%
Within the DJIA, only 2 names managed to show gains for the week. Those were MRK and JNJ finishing respectively up 0.2% and 1.6%. Healthcare names did quite well overall with the sector closing slightly more than 2% lower on the week significantly outperforming benchmark indices.
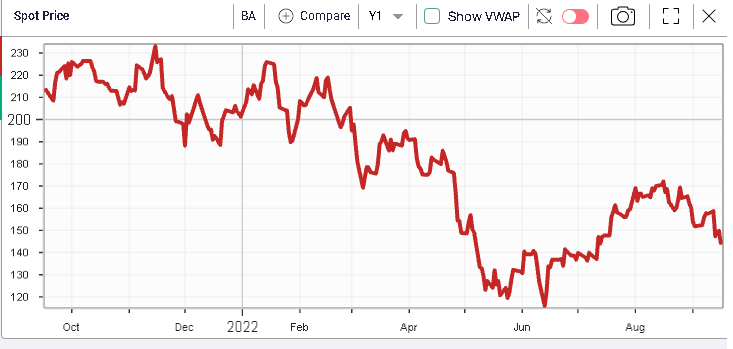
The worst performing single stock within the DJIA was BA which dropped more than 8% on the week. The stock had rallied 48.5% from the lows before turning around and drifting back down once again.
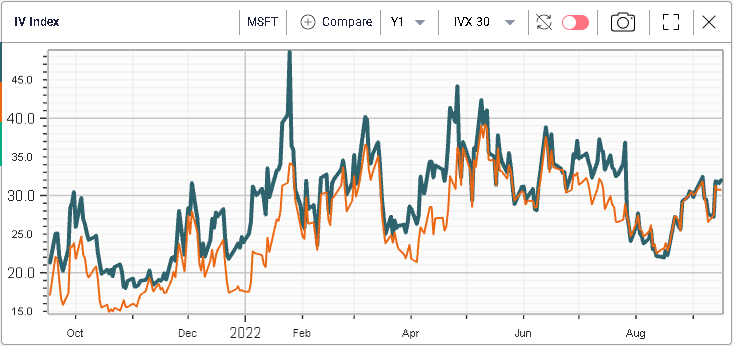
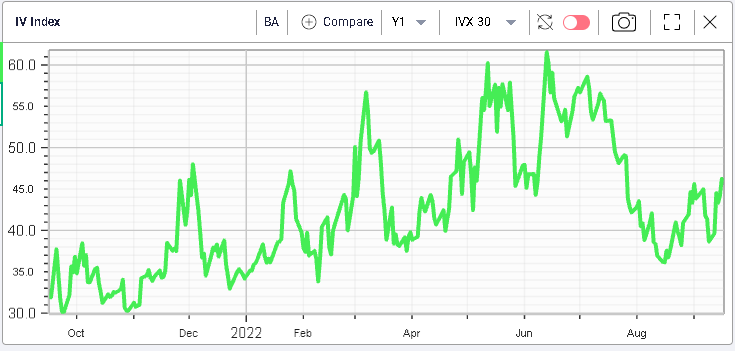
Implied volatility in the name has moved higher although there seems to be no panic from market makers at the moment regarding IV.
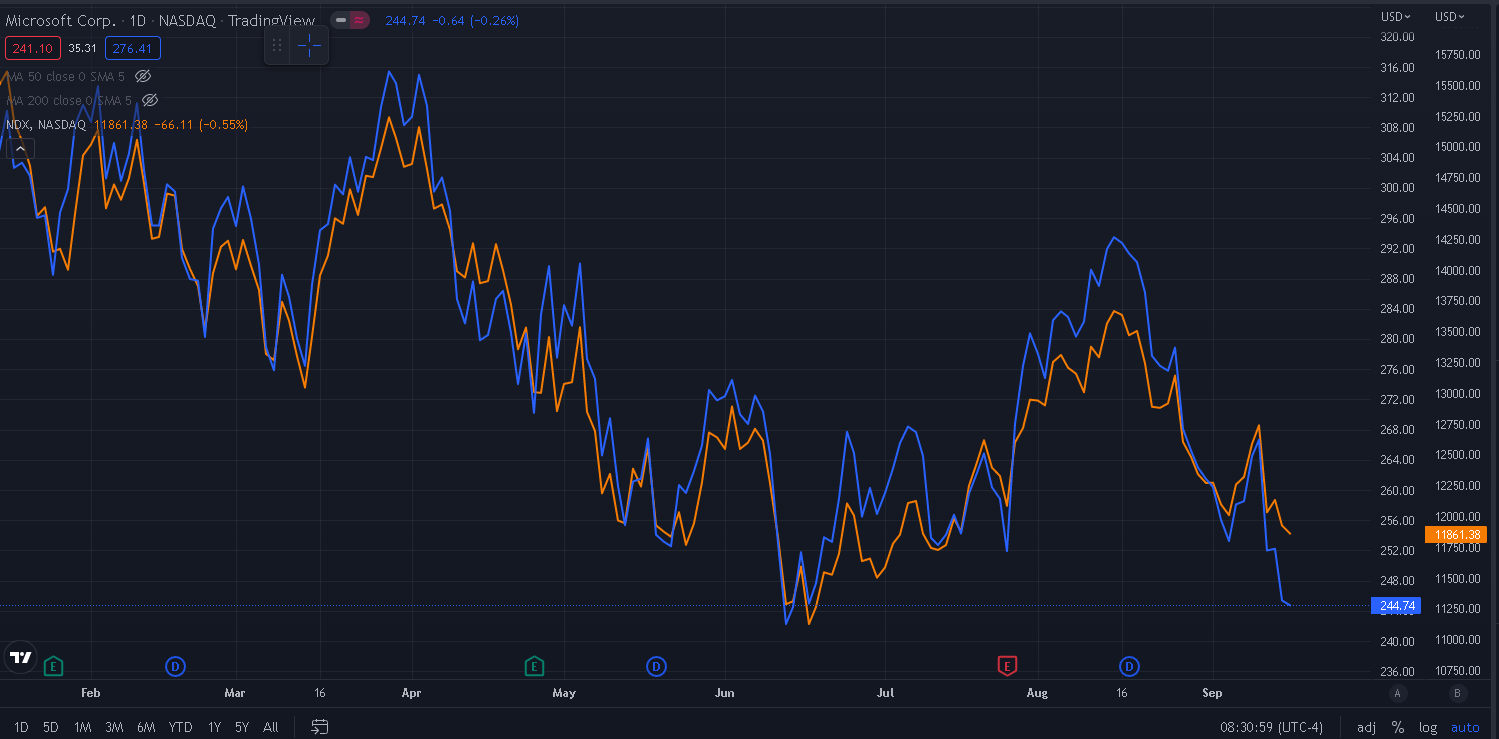
MSFT is another popular name that struggled over the past week dropping more than 7% and currently 27% lower on the year.
Interestingly on this recent leg lower, MSFT has underperformed the NDX as seen in the chart below with in orange the NDX and in blue MSFT.
Despite those, the implied volatility of MSFT and that of the NDX have remained extremely correlated with the spread at time of writing around 1.3 points.