Spot and Vol divergence
September 23, 2022
Markets traded around on Thursday with a slight drift lower in a follow-up move to what was seen around the close on Wednesday. This type of move will please both bears and bulls with the former reading it as a continuation of the prior day’s move while the latter will rejoice at the slowing pace at which the selloff is occurring. The SPX settled 0.84% lower, the NDX 1.17% and the DJIA was only 0.35% lower by the bell.
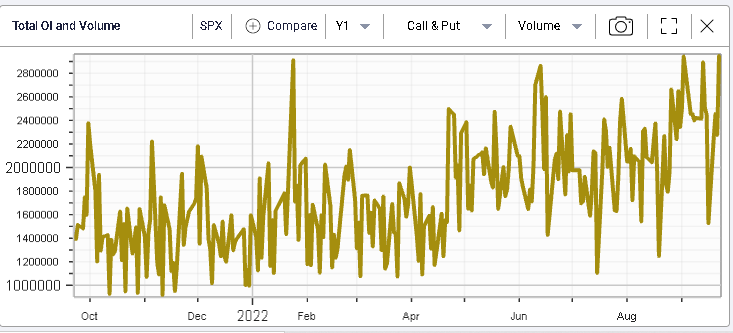
Yesterday saw a divergence happening between spot prices and implied volatility with both IV and spot finishing lower by the end of the day than where they had started as shown on the below charts.
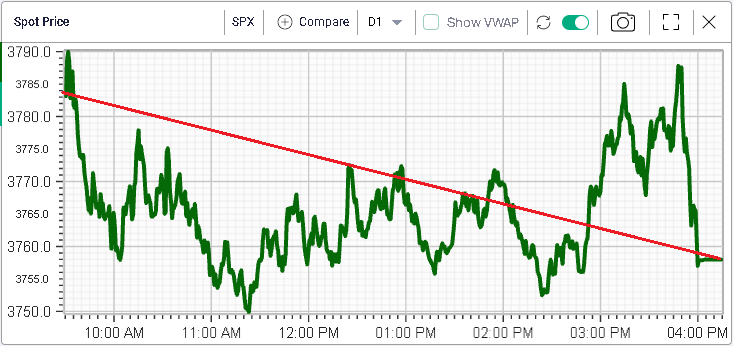

This situation occurred on a day of very large volumes for SPX options with one of the largest daily volumes for options in the past year.
This is does not happen that frequently as we have explained in prior market updates. In fact, since 2001, there are around 10% of the days when both spot and iv are up and 10% of the days when both are down.
Taking into account the fact that SPX spot was 0.84% lower and 30d IVX was 0.64% lower yesterday, we only see around 0.68% of days when both spot and iv moved lower by more than 0.5% on the same day. In 2022 alone, we record 5 such occurrences or about 2.75% of the traded days this year, a much higher frequency than in the entire history considered.
Using our REST API, we build the following graph displaying the SPX spot price and the instances when a spot/vol divergence greater than 0.5% was observed.
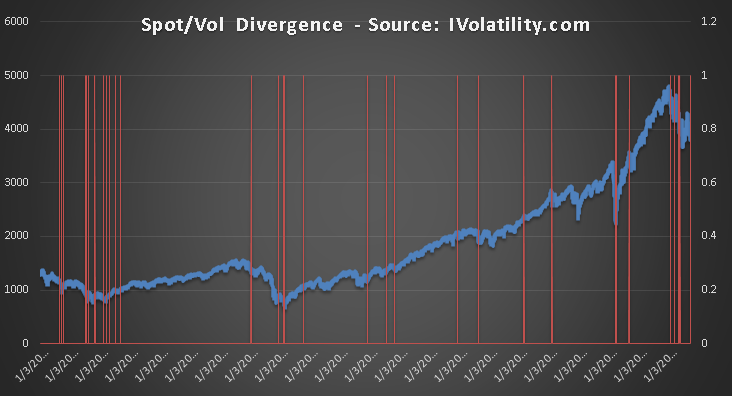
We find that over the entire history, around 68% of the time, the market finished higher within the following 30 days.
It goes without saying that past performance is no guide of future performance but we wanted to highlight how easily such an analysis could be performed using our REST API infrastructure.
Should you be interested in learning more about it, feel free to write to us on support@ivolatility.com