Fixed Income forces long term IV higher
September 26, 2022
Stocks were once again under pressure last week with ES Futures staying below 50d and 200d moving averages.
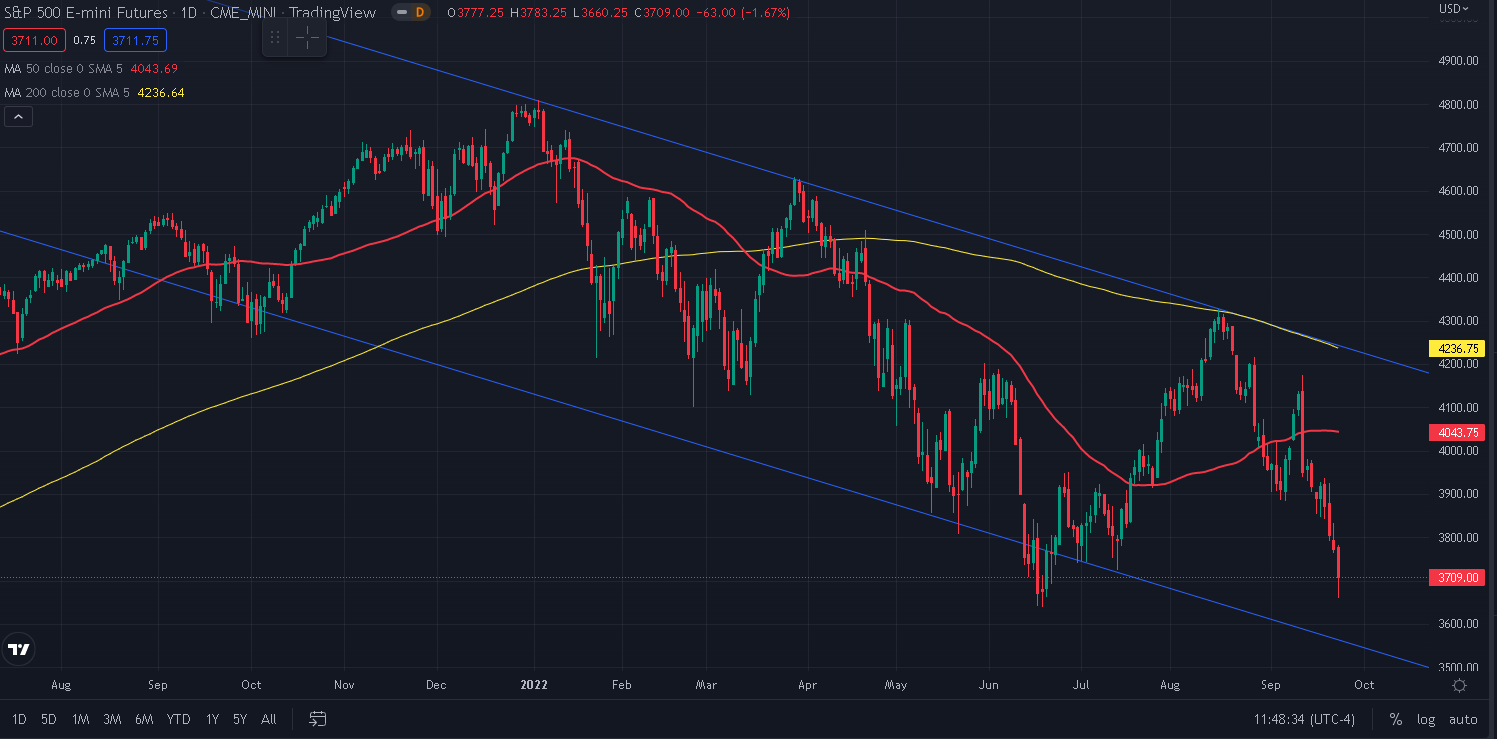
The SPX settled 4.6% lower over the week underperforming the NDX which lost 4.16%. Global Equities were also under pressure over the week with the French CAC dropping almost 5% and the Chinese HSCEI losing 4.8%. The outperformer for the week was the NKY which managed to lose only 1.5%.
As discussed during last week’s market updates, a fairly hawkish FED meeting was blamed for the selloff in stocks with a 0.75% rate hike delivered. The Bank of England raised rates by 0.5%, a move that was interpreted as conservative by media reports (FT) and resulted in weakness in GBPUSD (alongside the tax cuts and spending measures announced Friday).
Talking about rates hikes, the below chart constructed using our REST API shows the evolution of the yield curve throughout 2022 and how the market gradually came to the realization that it was underestimating the willingness of the FED to act and the number of hikes that would be required to stem inflation.
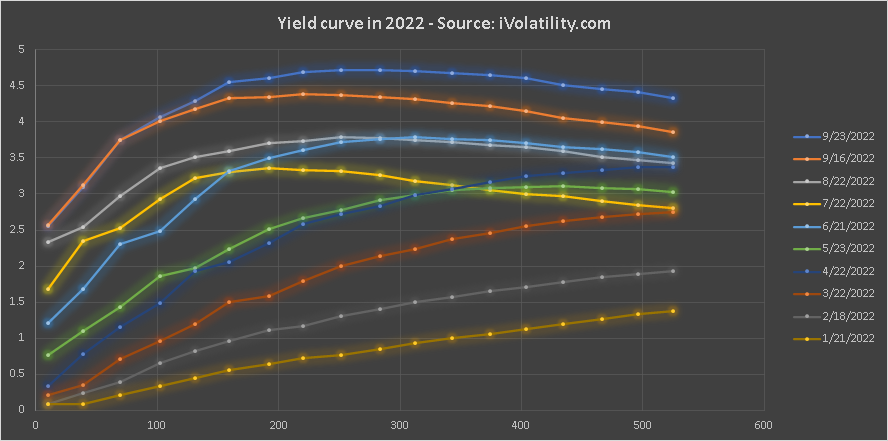
First, looking at the change over the last week, we can see that the impact of the FED was not so much a repricing of short dated rates which currently see yields reaching 4% in the next 100 days but rather a repricing of long-term rates.
Since the middle of the year, the dominant narrative in the Fixed Income market had been that the FED would front-load rate hikes in order to calm inflation but would quite quickly be forced to cut those rates again once the terminal rate had been reached.
Traders have held onto this narrative but have been forced to revise two key parameters in the face of the resilience of the FED (and inflation):
- The terminal rate expected for this hiking cycle (and when that peak would be reached.
- How quickly the FED would cut rates once the terminal rate had been reached.
The first chart below displays the Dec’23 and Dec’24 interest rates expectations for the market and show how once it became clear that the Fixed Income market was repricing the terminal rate higher around the middle of Aug’22, Equity traders started to have doubts about the rally in stocks and reduced their positions.
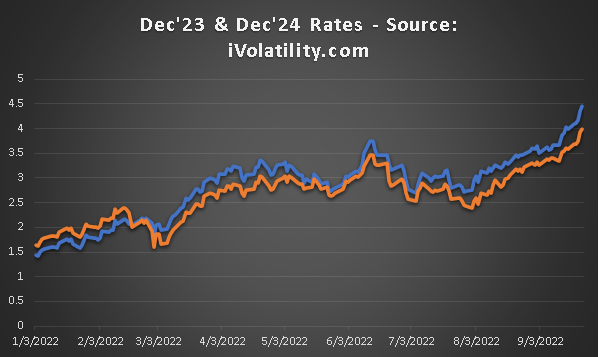
Following the May’22 hike of 0.5% by the FED, Fixed Income traders started to bring forward the date at which the terminal rate would be reached.
In May’22, the peak was seen around Dec’23. In June, the peak was seen around Aug’23. In July, the peak was seen around Apr’23. This supported the notion that the hiking cycle would be short which reassured Equity traders and could partly explain the bounce from June to August.
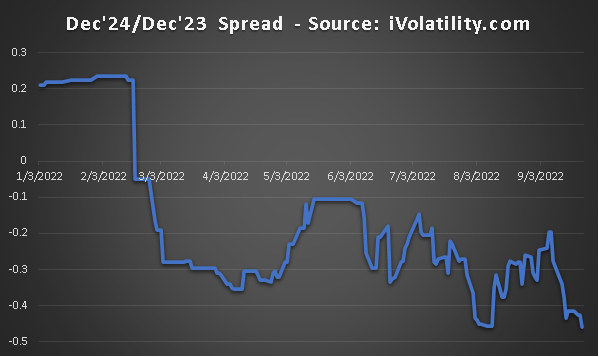
Now, it seems that the market is stabilizing around peak rates between May’23 and Jun’23. The problem is that, terminal rates expectations have increased in the meantime so that the market now expects a higher peak rate to be achieved over a shorter period of time that initially assumed. After that, it also assumes that the FED would have to cut rates at an even faster pace as shown on the below Dec’24/Dec’23 expected rate spread.
As the amount of uncertainty increases, options market makers have become wary of selling long term options at implied volatility levels that could prove too low. On the below chart, we can see that significant IV remark between the 23rd Sep’22 (red), the 22nd Aug’22 (orange) and the 22nd Jul’22 (black), in particular for long-term options.
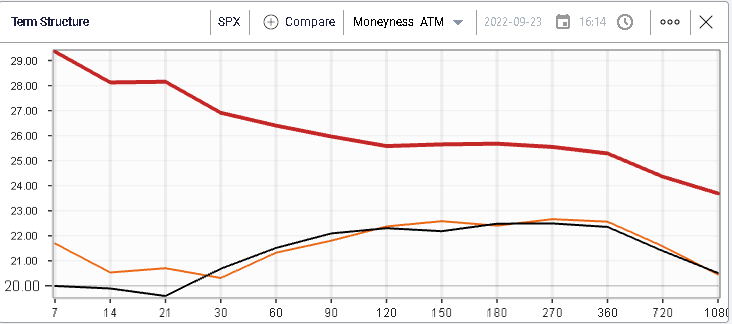
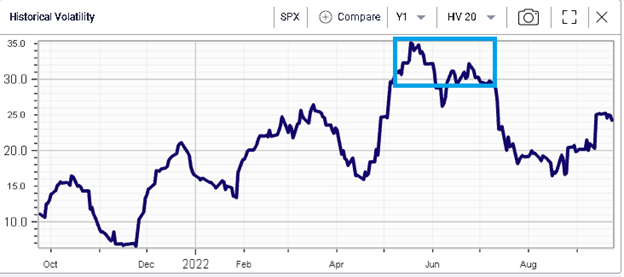
Options up to one year on the SPX are now priced with an implied volatility of around 25%. 6-month implied volatility for the SPX is fast approaching levels last seen in Jun’22, at a time when realized volatility was much higher than where it is currently (around 24% for the last 20 sessions).
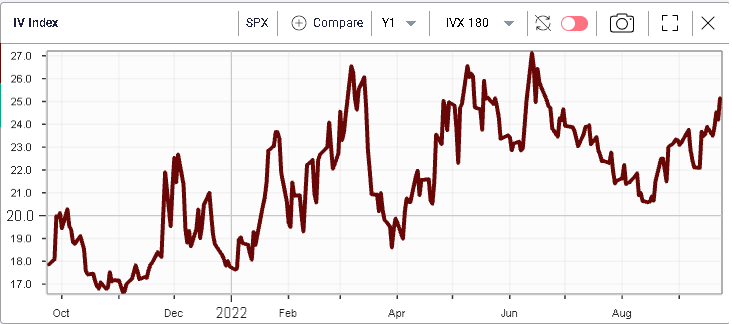
In other words, although in absolute terms, 6 months options are still priced with a lower volatility than in Jun’22, in relative terms they are now around 10 points higher, trading pretty much flat to historical volatility.
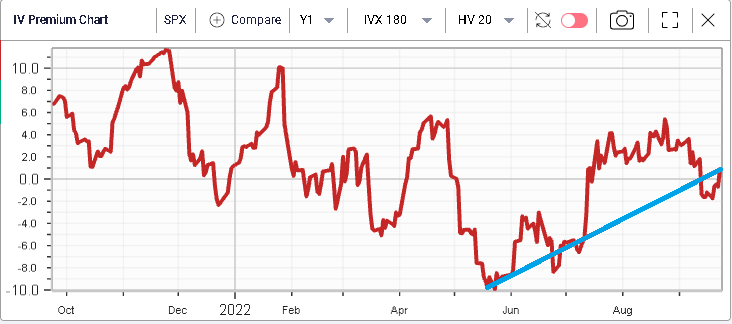
Had that been the case in Jun’22, we would have seen 6 months IV around 30%.
All in all, this creates a backdrop where market makers seem to request a greater compensation for the uncertainty around the future path of interest rates (amongst other things). Stock and Index traders able to construct medium to long term views should be able to find attractive risk-reward in the current market.