Rates volatility and concerns
September 28, 2022
Sideways trading for Tuesday’s session but with an overwhelmingly bearish feeling from reading the news or listening to other traders. This is probably explained by the price action that led to a -0.2% day on the SPX. Shortly after the US open, bulls tried to push prices back above 3700 but were rapidly rejected.
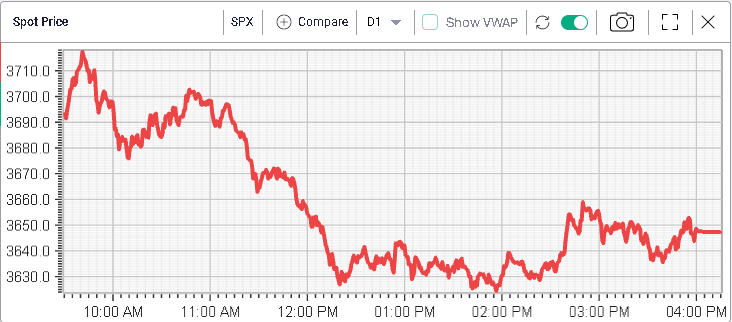
The high/low range for the day was a whopping 94 points but the change compared to the prior session was a mere 8 points.
This type of market favors day-traders who are able to navigate between various bouts of volatility. Medium term investors tend to find it much more difficult to stomach the amount of volatility in the market.
Talking about volatility, the 30 days IVX is now back around the key 30% level that has capped all moves higher in IV in 2022.
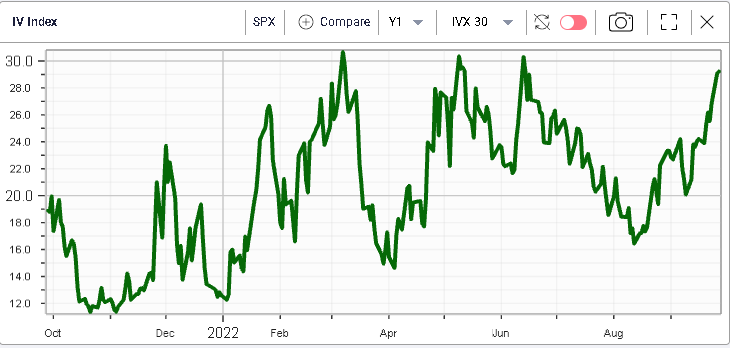
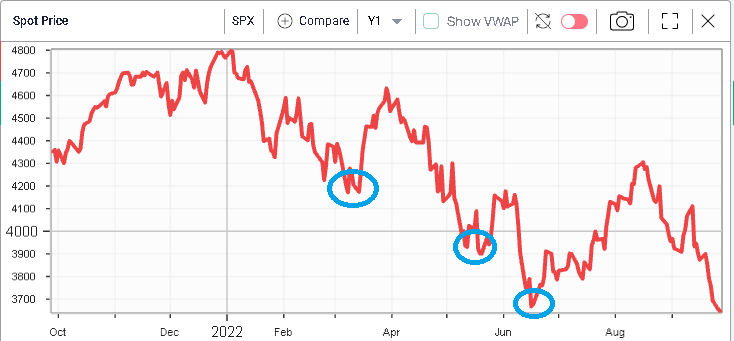
That indicator has coincided with the three major bottoms made in the SPX so far this year and it will be an important one to watch over the next few days.
Looking at the news yesterday, media reports remain very much focused on the hawkishness expressed by most central bankers around the globe with various ECB speakers delivering yet another strong signal that major interest rate hikes are going to be happening in the short term.
As a result, yields in Europe have continued to move higher with 2-year GER trading around 1.94% at time of writing and 10 years yield around 2.33%. This increase in interest rate is not spread evenly across all European countries with the market becoming more wary of those with fiscal trajectories that seem unstable. This explains why, following the mini budget from last Friday, 10-year UK yields have now reached 4.5%, their highest levels since 2008.
Other countries are also impacted, for instance Italian 10-year yields are now trading at 4.87%, Spanish 10-year yields have moved to 3.5% and French yields are at 2.93%.
If yields stay at elevated levels for long periods of time, this will start to impact public finances quite rapidly and it remains an open question how major DM countries with very large debt stocks would be able to adapt to this new environment. Considering the vast quantities of bonds held at major Central Banks, worries might also arise around the potential steep losses that could be realized by those institutions.
With all this considered, it is not that surprising that long bonds volatility has now reached its highest level in at least 5 years (outside of the pandemic).
