BA and WBA underperform
September 30, 2022
It seems that so far this week the market has been consolidating and despite the large bouts of volatility, we have not made significant progress in either direction.
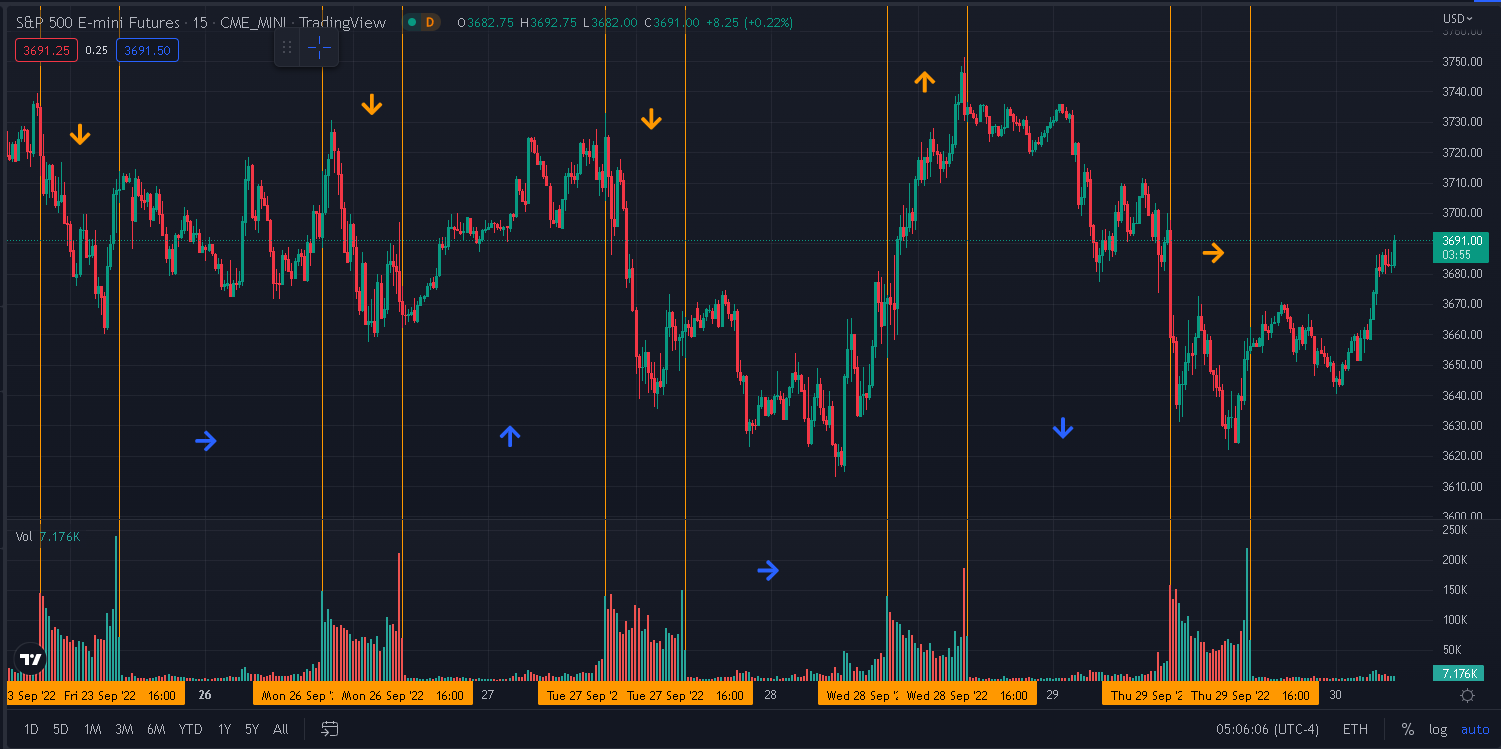
Looking at the last few sessions on ES, the price action is quite interesting. On Friday, Monday and Tuesday, the cash sessions were very bearish with prices moving lower significantly during the high-volume period.
Bears pushed prices, committed capital and found themselves possibly a bit too short on Wednesday which resulted in a large bottom left, top right short squeeze. It is never easy to differentiate a short squeeze from real buying but, considering the price action in the overnight session (Wednesday to Thursday) and the slow drift lower, we would be tempted to assume that shorts were reduced on Wednesday (if the market had been driven by real buying, we would have expected opportunistic bids to support the market on the way down and halt the grind lower).
In any case, as of Thursday’s close, the SPX was trading a mere 1.4% lower on the week. The SPX finished lower by 2.11% during Thursday’s session alone, the NDX was 2.86% lower and the DJIA 1.54%.
Looking at the DJIA components, we note the very negative performance of AAPL which lost almost 5% on the day. For more information about this name, please read yesterday’s market update where we discussed IV, HV and more on AAPL.
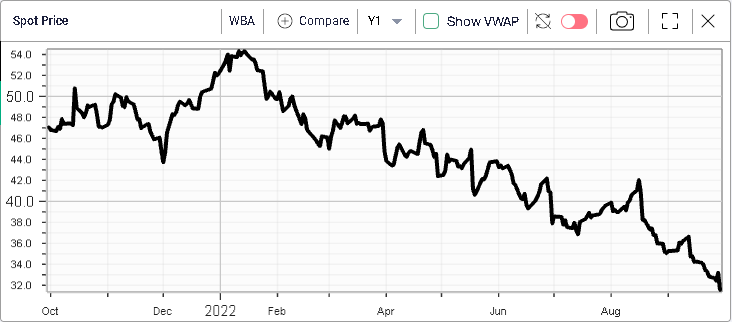
BA also struggled yesterday losing more than 6% over the day. After a strong rally in the summer, the stock is now back towards its Jun’22 lows and implied volatility has followed spot fairly closely.
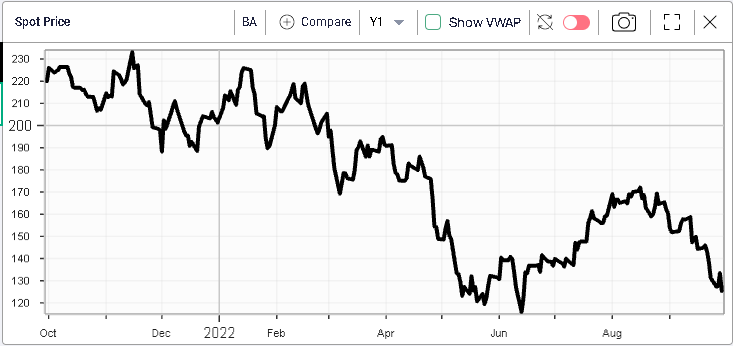
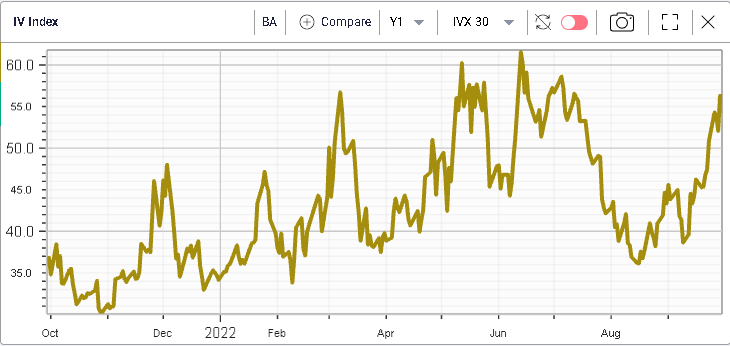
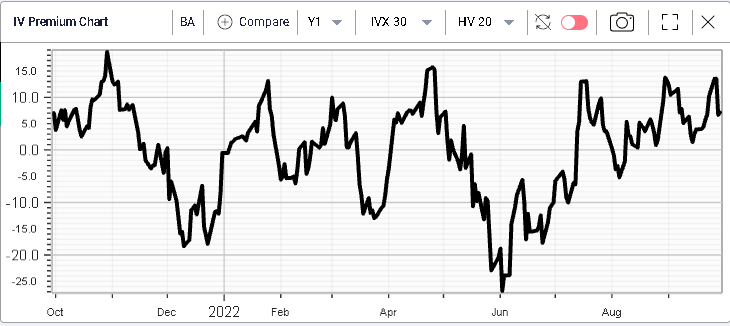
It is worth noting that as realized volatility has been more benign than in June, this has resulted in an IV Premium which is much greater this time around, a sign that market makers are getting quite nervous about the situation in the name and looking for an even greater compensation to sell options.

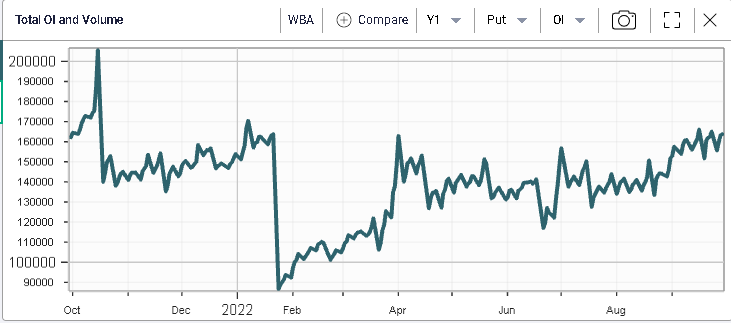
WBA was another stock that struggled in Thursday losing 4.97% over the course of the session. The company has slowly drifted down around 40% in 2022 and IV in the name is now around 45%, its highest level since 2021.

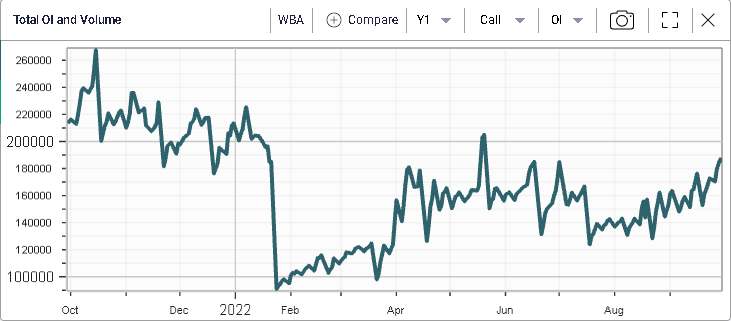
Put and call positions in the name have increased over the year with put open interest at its highest level for 2022 and call OI very close to it.