A taste of 2008 and an important jobs report
October 3, 2022
Equity markets continued to trade lower this week on growing volumes with the SPX, the DJIA and the NDX all losing around 3% over the week.
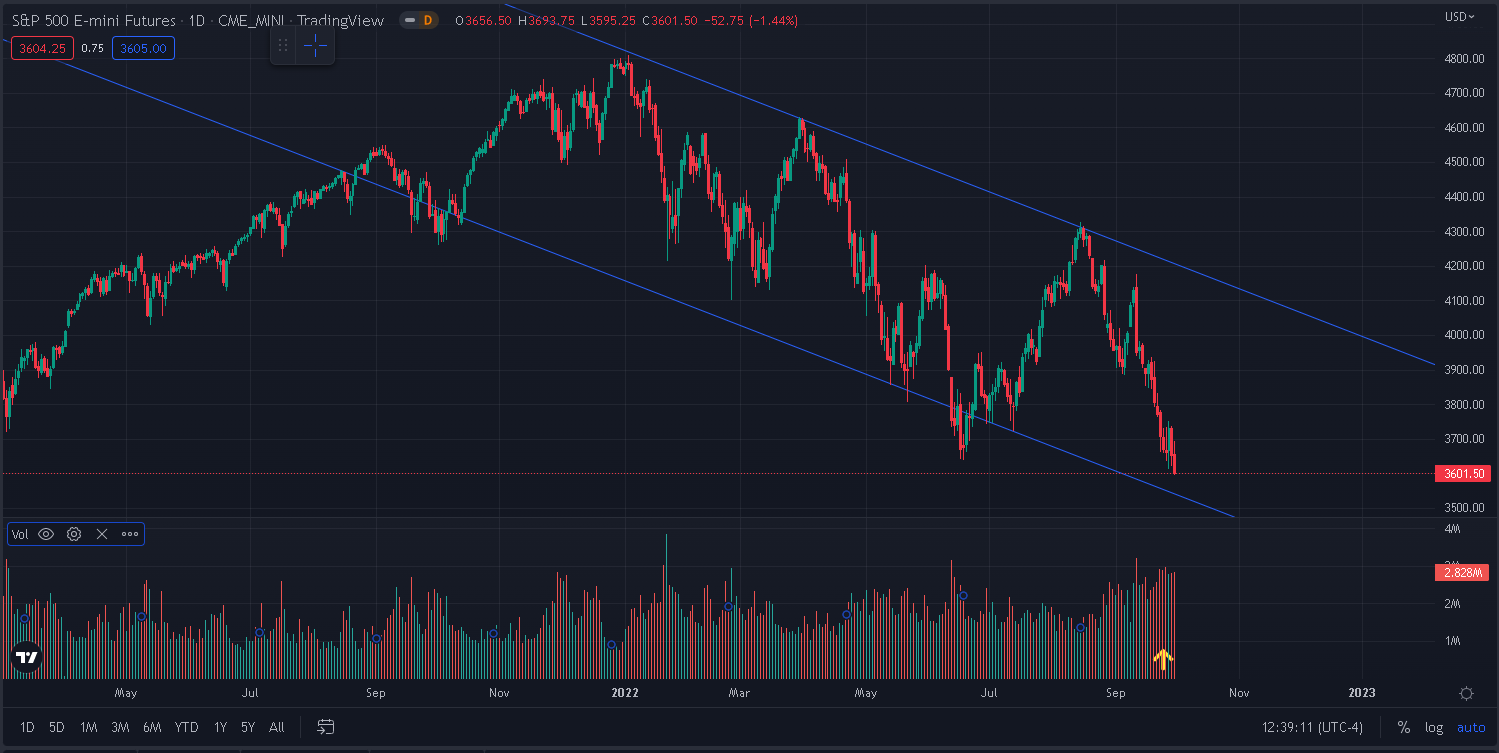
Source: Tradingview.com
Europe seemed to perform slightly better with the French CAC finishing almost unchanged over the week and the German DAX dropping slightly more than 1%.
Looking specifically at the German DAX, the 2022 downtrend remains clearly visible with the market trading below both its 50d and 200d MA.
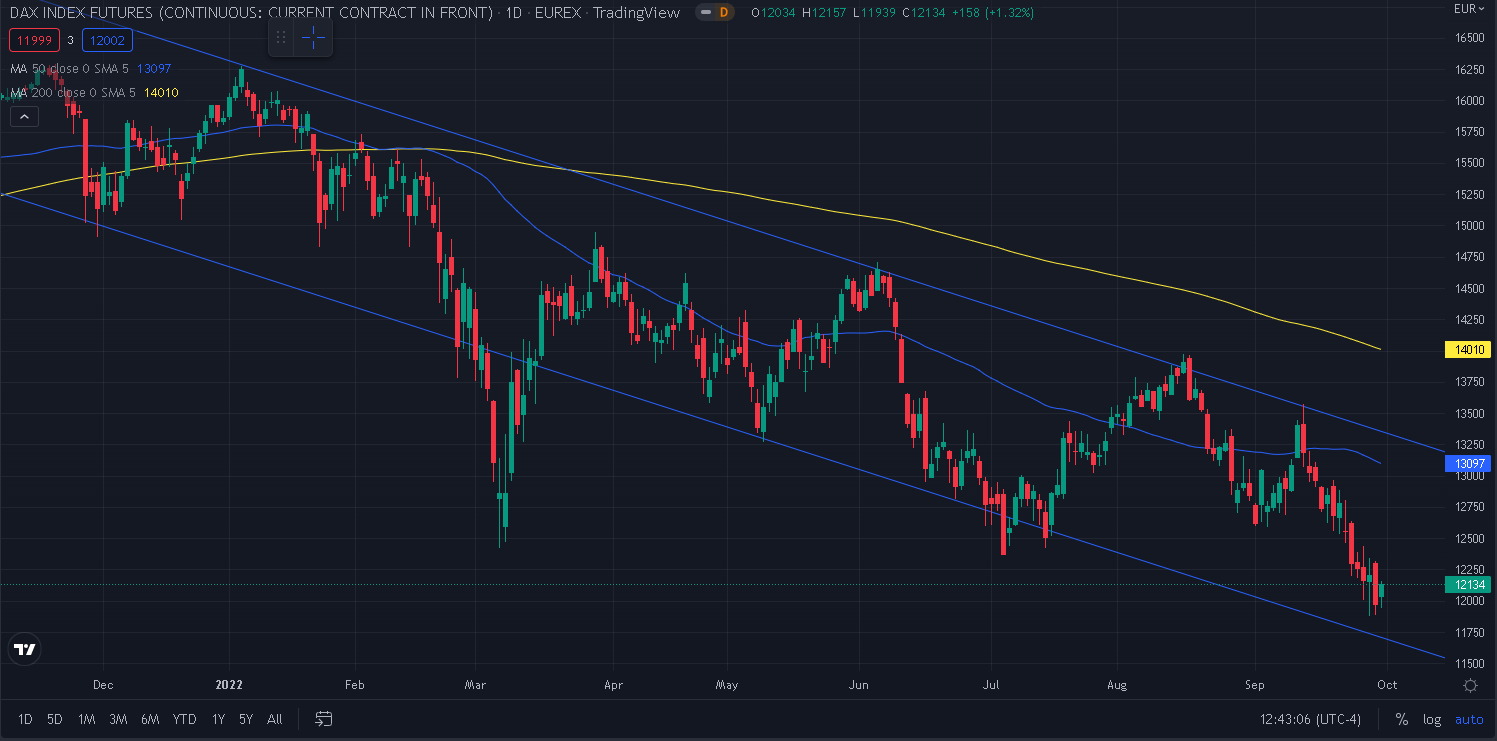
Source: Tradingview.com
Talking about the downtrend, one interesting metric to study is the number of consecutive days when the market makes a new low in a bear market (and a new high in a bull market).
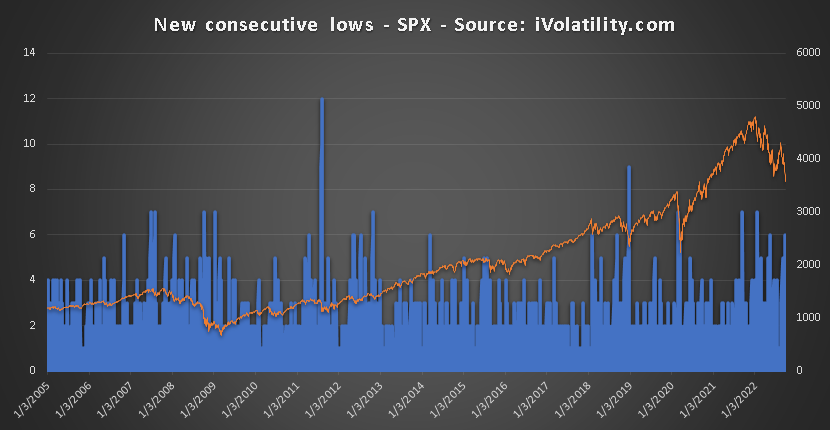
The above chart shows the number of consecutive new lows made in the market compared with the SPX price. Series longer than 8 consecutive new lows are very rare (7 instances over the last 4470 trading days) and the longest series seen this year have been of 6 and 7 days respectively. Longer series are generally thought to be associated with unexpected risks suddenly appearing in the market that result in a large capitulation.
Last instances were seen in January of this year when the market started to slide rapidly as the FED’s pivot towards a more hawkish stance became more obvious to market participants who had previously assumed that the FED’s capacity and willingness to raise rates would be limited.
Likewise in September 2021, we got another 7 days series as the market was getting more concerned about the state of the Chinese property sector, an area where the focus had been limited for most participants and that took center stage as Evergrande’s troubles were reported by media outlets.
The market recorded a 7 days series on COVID towards the end of February 2020 and more interestingly a 9 days series in late 2018 when the market became concerned that the FED was going to raise interest rates much sooner than anticipated and stop its bond buying program earlier than thought by most.
The most recent selloff on the other hand has not seen any out of the ordinary series. We had a few 5- and 6-days series in the last few months but nothing that resembles the shock and quick capitulation seen in prior instances.
From that angle, this selloff seems to be much closer than what was seen in 2008-2009 than to any other selloff in the last 12 years.
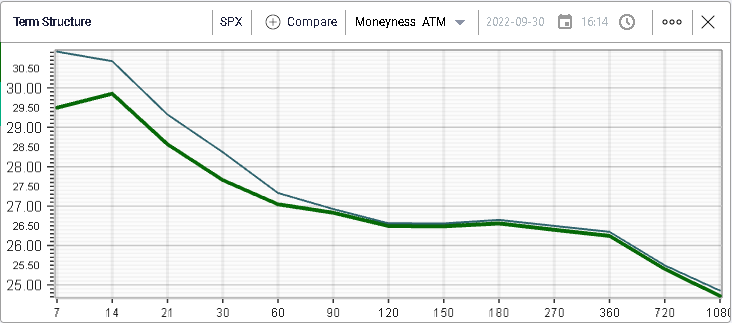
On the implied volatility front, we are back to 2022’s highs as seen in the below picture but for now the 30d IVX has remained below 30% IV.
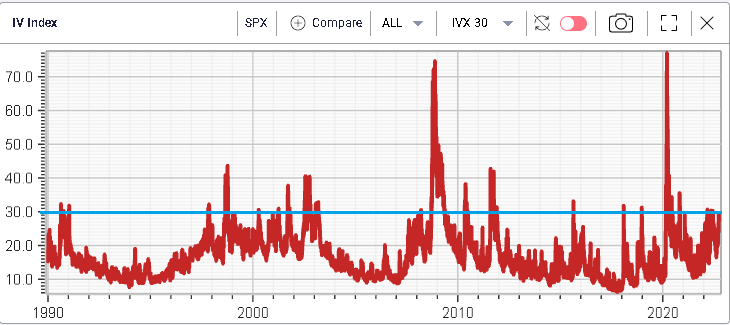
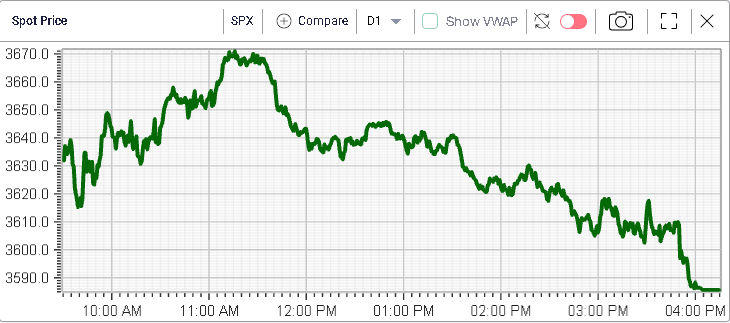
Despite Friday’s selloff with the market closing below 3600 at the lows of the day, implied volatility moved slightly lower with the 30d IVX finishing around 28.5%.
From a sectorial perspective, the Energy segment was the only one that managed to finish in the green over the week gaining around 2% (Crude Oil was largely unchanged over the week).
On the other hand, utilities struggled losing more than 8% over the week. What is very interesting in that move is the fact that Utilities have performed as highly defensives stock in 2022. In fact, the sector on average was up on the year only a week ago. It is now 7.5% lower YTD.
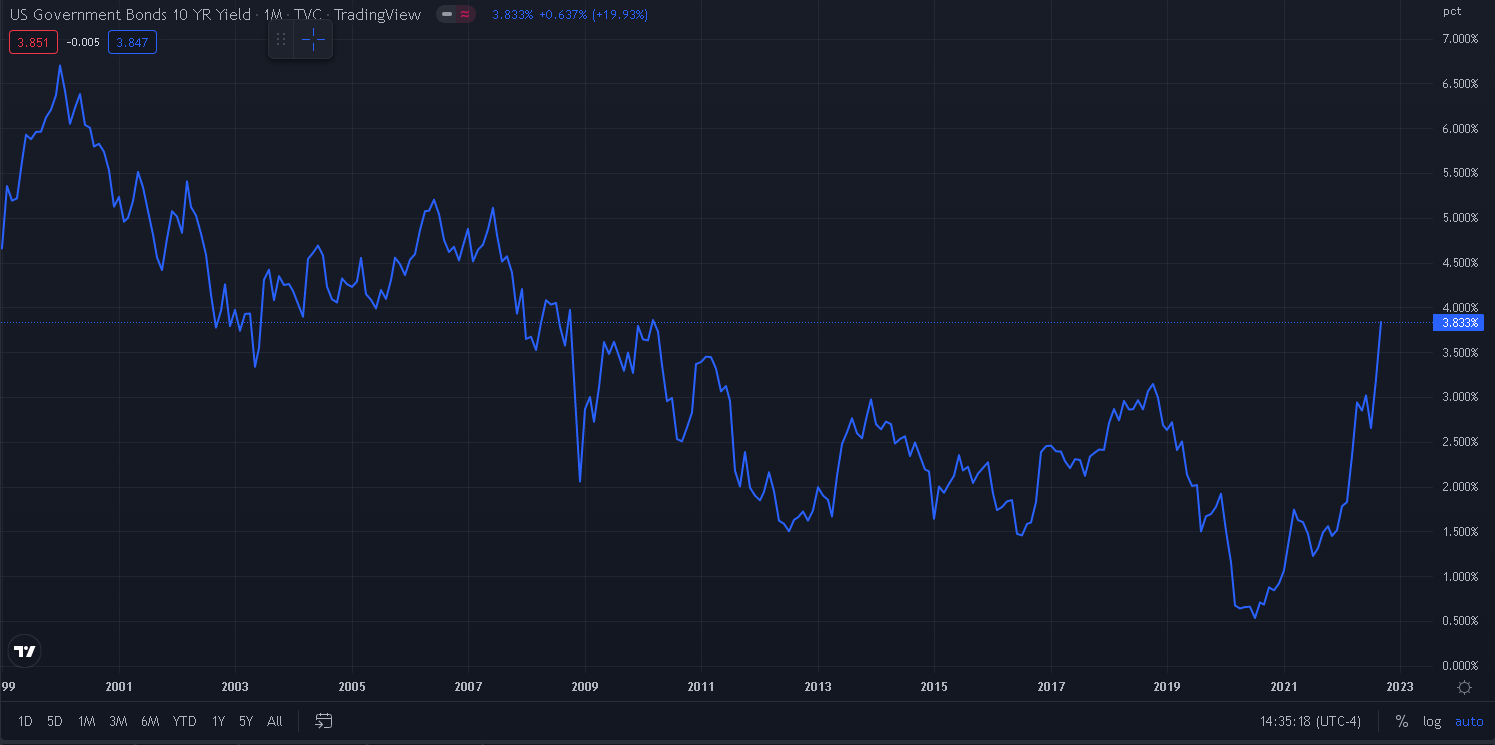
One of the key concepts around defensive stocks is the notion that they are able to offer stable long term dividend yields. This is an important point for investors because in most crisis, the market generally reacts by moving out of risky assets and into safer alternatives. As traders rush to buy US Treasuries (which are generally perceived as the safest investment), the yield on those drops significantly forcing traders to search for alternative safe places to park their money.
This time though, things are quite different. The perceived increase in risk is in large parts related to the increase in interest rates which discourages investors from holding on to US Treasuries. As a result, the yield on 10-year US paper has moved from a low of around 0.5% in 2020 to a level of 3.83% currently.
As yields have gone up, traders may have started to rethink their interest in utility stocks. As those names have remained unchanged in 2022, the dividend yield has been expected to stay around 3.1% or 0.7% less than where 10y US paper currently trades.
Large losers over last week also included Real Estate stocks (-4% and -30% YTD), Tech stocks (-4% and -32% YTD) and Consumer Staples (-4% and -13.5% YTD).
As the new quarter starts, the market’s focus will be on the jobs report on Friday as well as the OPEC+ meeting where traders have been questioning whether a cut of production could be on the cards.