IV premium compression across Equities and Fixed Income
October 5, 2022
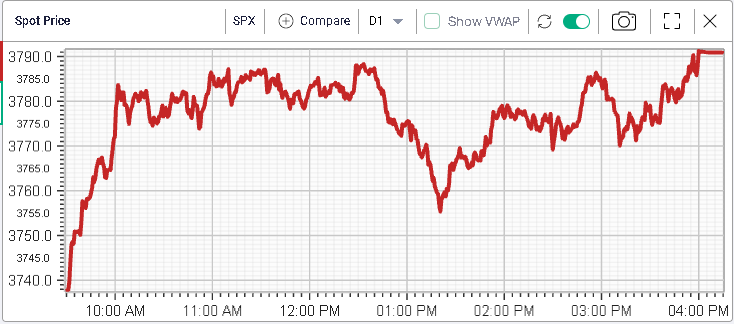
Strong rally across equities yesterday with European assets gaining most. The German DAX surged 3.8%, the French CAC rallied 4.2%. US indices also performed very well gaining around 3% over the day both for the NDX and the SPX.
Implied volatilities remarked lower over the session with 30d IV losing around 1% over the day.
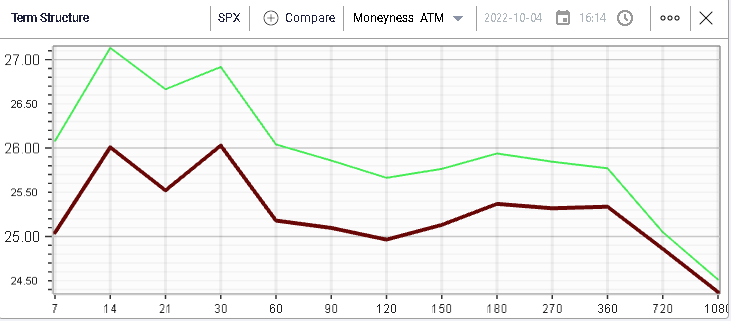
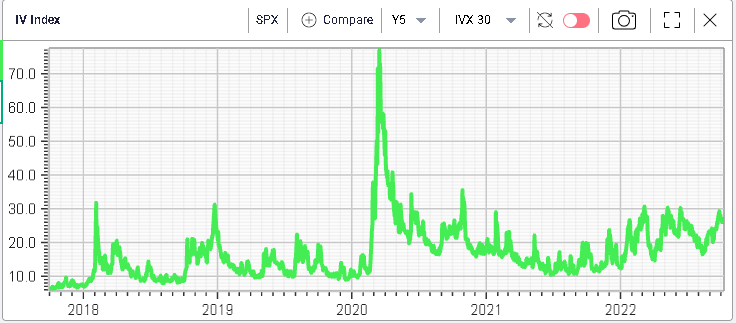
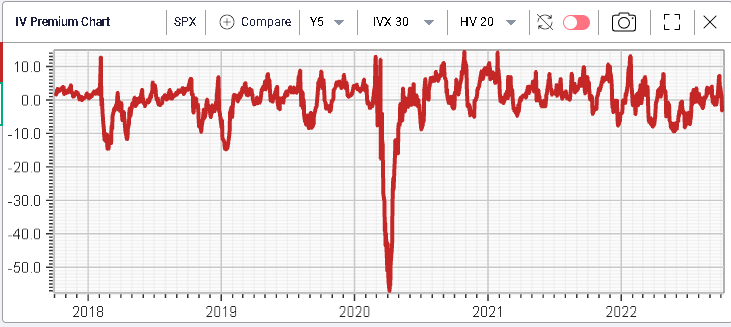
For now, the 30d IVX has remained under 30% the key pivotal level that has capped all IV expansions in 2022.
Considering the most recent IV selloff, the IV premium for the SPX has now turned negative again with 30d IV trading at a 3% discount to 20 days realized volatility.
The rally was triggered by the release of jobs opening which showed a slowdown in the number of openings outstanding in the US according the media reports (FT.com).
The job market matters because it had so far failed to show signs of weakening despite the very hawkish rhetoric from the FED and the rate increases. The current backdrop thus reassured investors that, as the real economy was reacting to the FED’s actions, the need to slow things much more might be avoided.
Over the past few days, 10-year yields have retreated, from a high of 3.92% to their current level of 3.68%.

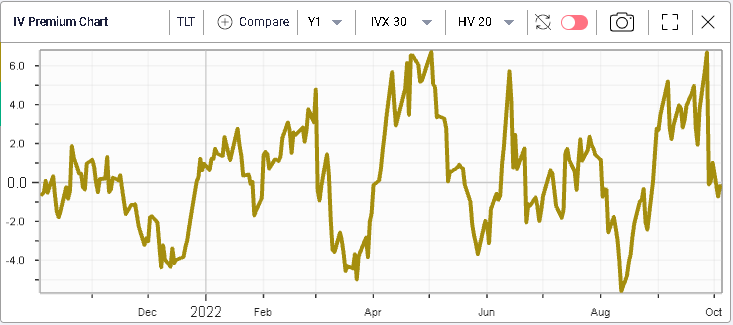
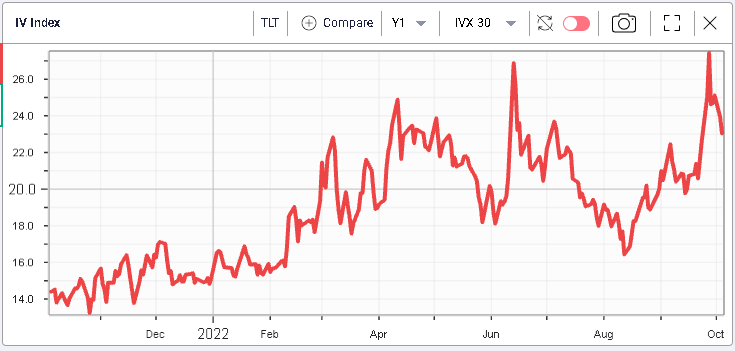
Bonds have been under intense pressure in 2022 and looking at the above 12 months price chart of TLT shows how much damage has been done to the space.
Over the past few weeks, implied volatility for TLT had reached new 12 months highs but it has now started to compress once again and is currently around 23%.
The IV premium for TLT is trading around flat at the moment after hitting a 12-months high of +6%. Market makers are less concerned than a few days ago but remain careful not to sell implied volatility too quickly.