Not much at surface level, more to see underneath
October 6, 2022
Markets traded around on Wednesday and settled largely unchanged although some decent dispersion was noticeable under the surface.
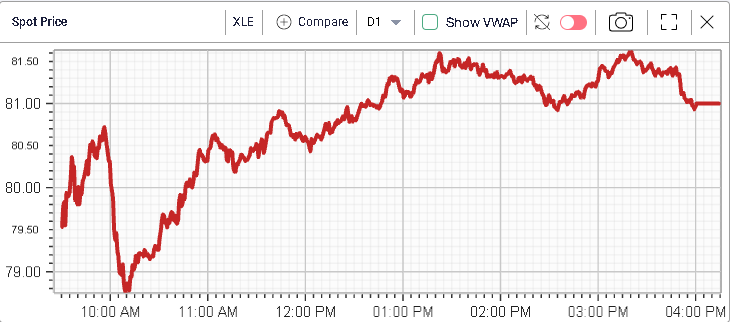
On the upside, energy stocks were supported with the OPEC’s decision to reduce production by around 2mm barrels per day pushing Crude Oil prices higher (USO gained 2.4%). The XLE finished 2.07% higher.
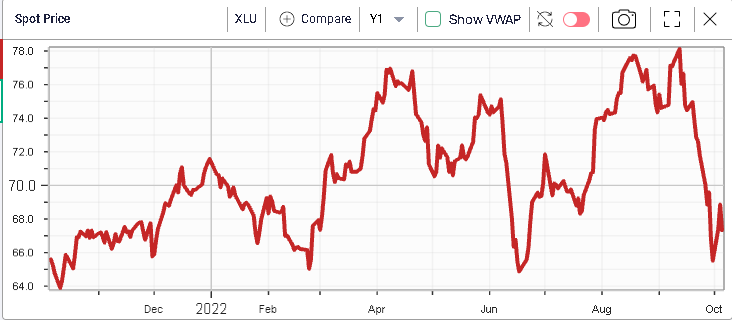
On the downside, utilities struggled and lost 2.2%. This takes the performance over the past month to -10% with a year to date down 5%.
It is definitely worth watching this space as it seems that traders seem to have been taking a completely different perspective over those stocks in the last 30 days pushing them back to their lows of 2022.
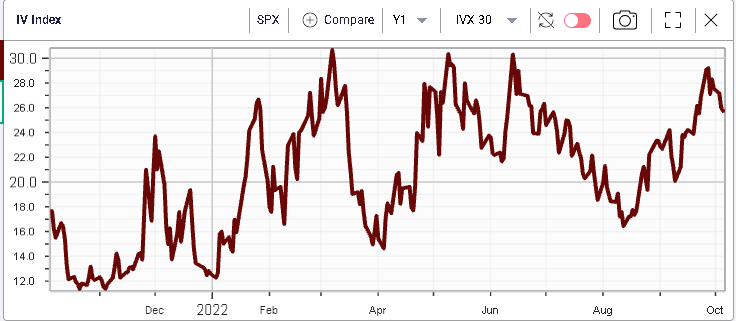
Index volatilities were largely unchanged over the day with 30d IVX on the SPX gaining around 0.2%.
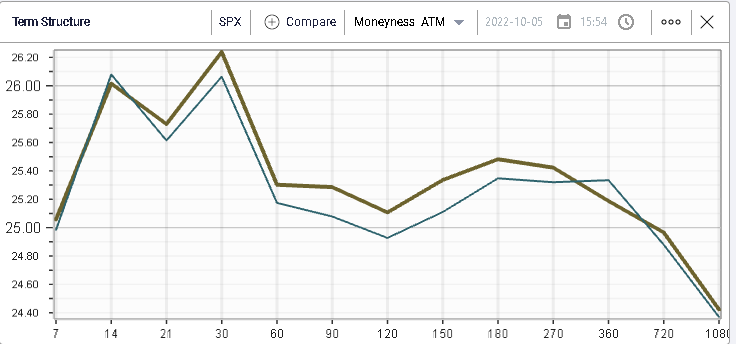
Implied volatilities have deflated over the past few sessions but it will come as no surprise to frequent readers that the key levels watched by traders is around the 30% mark for 30d IVX.
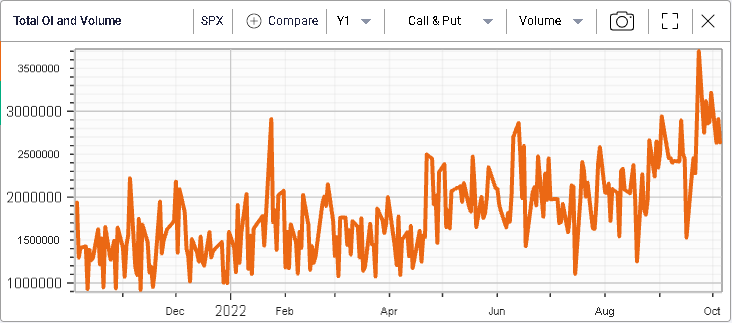
Volumes have stayed at elevated levels as seen below with the SPX printing 2.6mm contracts.
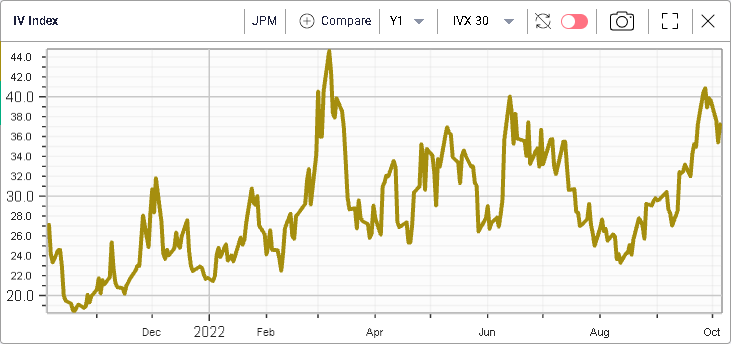
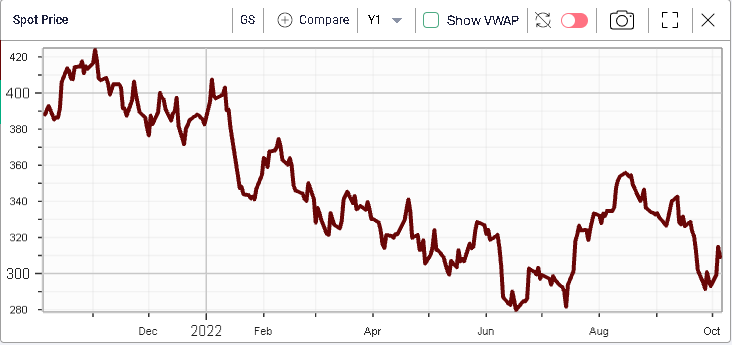
Looking at the DJIA components, we note the underperformance of banks with JPM and GS losing respectively 1.2% and 1.9%.
The selloff in those names has been continuous over the past year with JPM down 32% YTD and GS trading 22% lower.
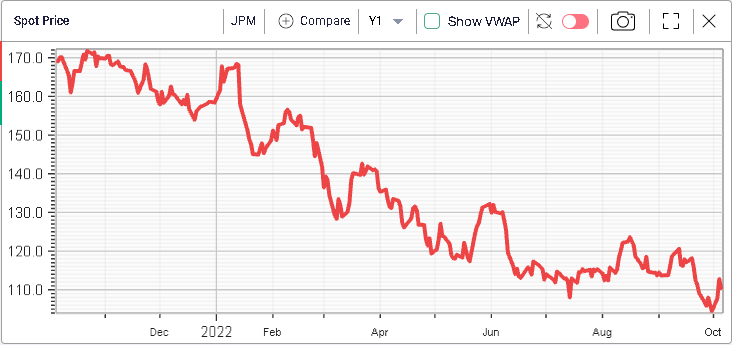
Looking at implied volatility for JPM it is currently around 37% for JPM 30 days, still below its 12 months high, a sign that market makers have become more comfortable with the current price action even though it remains very negative.