Markets hold but Semis get hit
October 10, 2022
Markets traded around over the week with a slight positive bias despite the selloff late in the week. The SPX managed to gain 1.5%, the NDX trailed and finished 0.75% higher. European indices moved higher as well with the German DAX finishing 1.5% higher and the French CAC gaining almost 2%. Asian indices fared better over the week, the HSCEI was almost 3% higher while the NKY gained 4.5%.
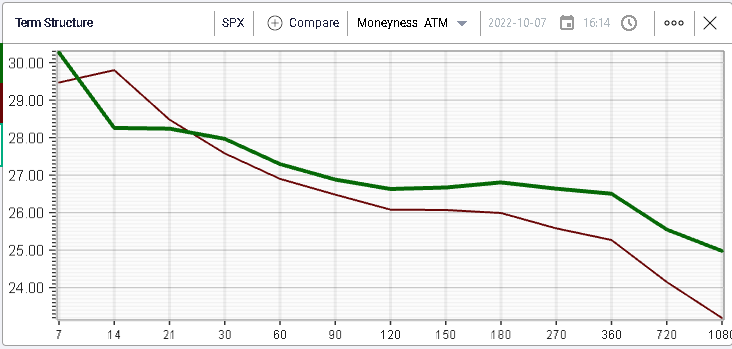
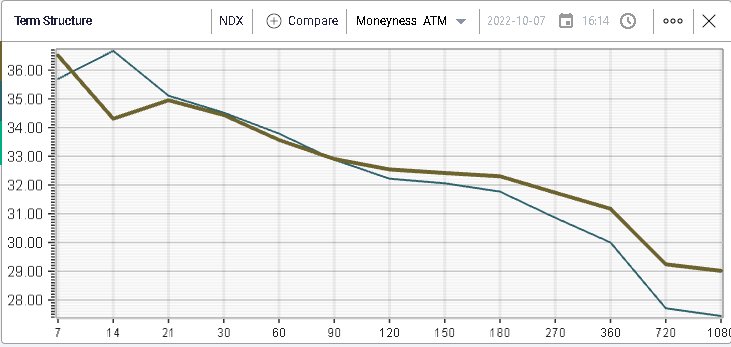
Implied volatilities were supported despite the move higher, mostly helped by Friday’s aggressive remark following payrolls which sent the SPX 2.8% lower and the NDX 3.9%. The charts below show the term structure for the SPX and the NDX with 30d IV moving higher by around 0.3% on the SPX and staying unchanged for the NDX.
As we pointed out during last week’s market updates, the situation was not homogenous at the sector level. For instance, we saw a strong outperformance of the energy segment which was by far the best performing one over the week gaining more than 13% driven by a very strong performance of Crude Oil which finished higher by around 15%.
On the downside, we note the underperformance of utilities which lost around 3% over the week and of the consumer discretionary segment which settled around 1.5% lower over the week.
This overall attitude was reflected at the single stock level with CVX gaining almost 12% over the week.
Other interesting stories over the week were found in CAT which pushed more than 8% higher over the 5 trading days. The stock has lost around % in 2022 so far.
After a period of underperformance, BA seemed to have found support as it approached its June lows.
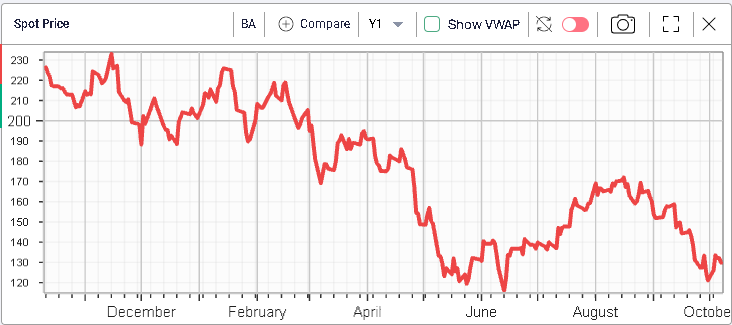
The stock gained almost 7% over the week but remains 38% lower compared to its closing value of 2021.
From a pure implied volatility perspective, the move in INTC looks quite interesting with the 30d IVX now breaching the 55 level and reaching its highest level over the past 12 months.
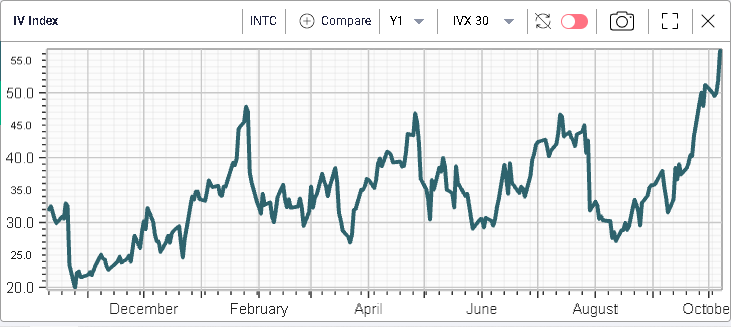
The stock continues to drift lower in what looks like a continuous selloff and repricing of the shares. The company has lost around 52% of its value in 2022 so far and market makers seem to be gearing towards some large move in the near future.
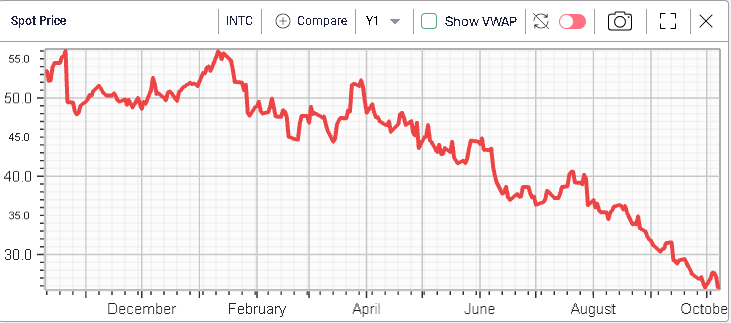
The company lost around 5.4% on Friday in sympathy with the broader sector that was being impacted by the AMD results which turned out to be disappointing. AMD stock lost around 14% over the day. INTC is expected to report Q3’22 on the 27th Oct’22.