IVs at the high into earnings season
October 11, 2022
Stocks drifted lower with the NDX underperforming slightly and closing -1% while the SPX closed down -0.75% over the session. Despite this, implied volatility still remarked slightly higher with 30d IV moving up about 1 point over the day.
At the sector level, energy underperformed slightly losing around 2% over the session as Crude Oil lost around that much on Monday.
Technology stocks also underperformed with the segment dropping slightly more than 1.5% by close of business.
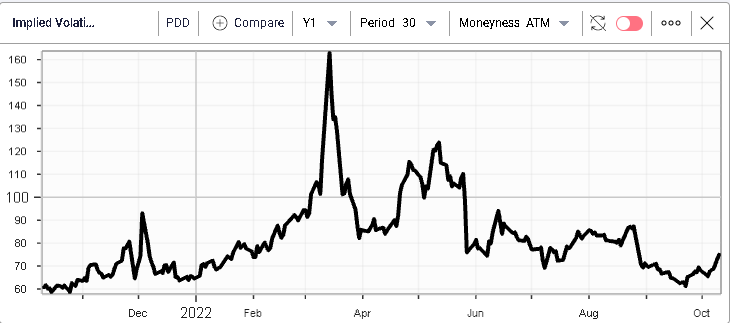
Even amongst this sector not all stocks were treated equally. On the downside, names like PDD were impacted quite strongly losing more than 8%. The stock is largely unchanged in 2022 but according to media reports (Seeking Alpha), Chinese stocks were under pressure following the US announcement of controls on exports of American semiconductors.
Despite those new worries, market makers have kept implied volatility at historically low levels with the 30d IV trading currently around 75%.
The IV premium for 30d IV vs 20d HV is currently hovering around 17%, lower than prior peaks in the name.
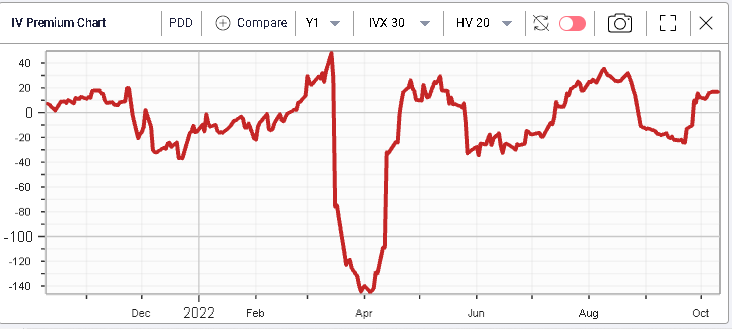
Options volumes have remained fairly limited in the name so far.
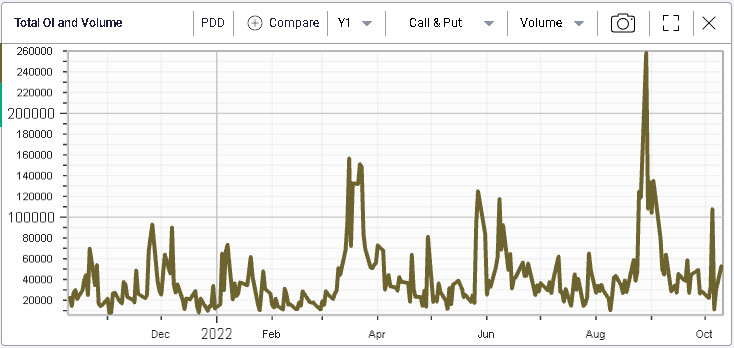
This could potentially be explained by the overall performance of the company which, when measured in absolute terms, looks pretty underwhelming in 2022.
Most traders will either be looking for stocks that look overextended on the downside (oversold) or stocks where the performance has been extremely strong. Whether they act as trend followers or contrarian in those cases is down to personal belief and preferences.
In all instances, it seems that average stock that don’t have much to show for themselves (even though being unchanged in a year when the SPX has lost 25% can be called outperforming) don’t seem to attract too much attention from directional traders.
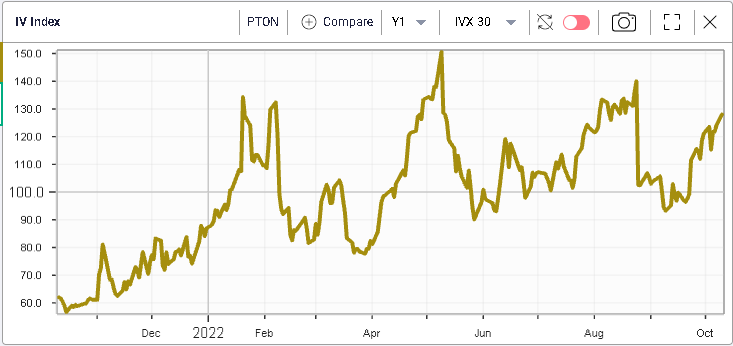
On the upside we note that PTON had a fairly good day gaining 4.6%. 2022 remains a very difficult year for the company with its stock having lost almost 74% year to date.
Implied volatility has remained firm in the name currently around 130% for 30d IVX.
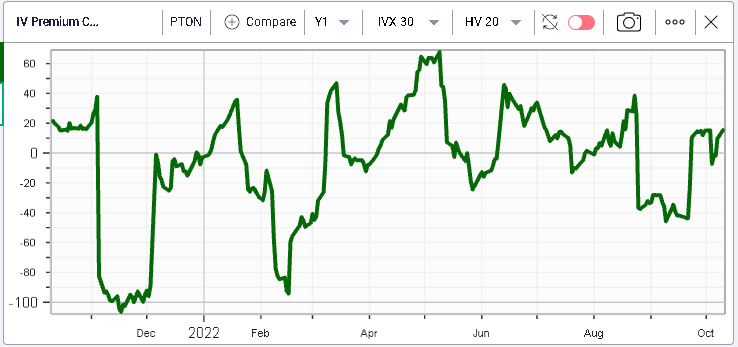
This translates into an IV Premium around +16 lower than the last 12 months’ peaks.
The market’s attention this week might move from macro to micro with only a handful of economic releases expected to catch trader’s attention. Specifically, the market will be looking at PPI in the US on Wednesday, expected at 8.4% YoY. The FOMC minutes will also be released on Wednesday.
German inflation on Thursday will likely be scrutinized expected at +10.9% YoY for September while the US will also release its CPI which is seen at +6.5% YoY for September.
More CPI figures will be released across the globe on Friday for instance from China and France. Retail sales in the US on Friday will also matter a lot for the broader sentiment as well as the Michigan consumer sentiment survey.
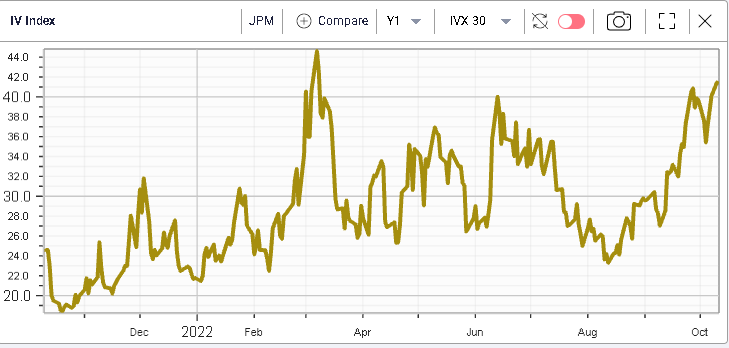
At the micro level, earnings will really kick off on Friday with banks leading the reporting season with JPM, MS, C and WFC all expected Friday although PEP is expected on Wednesday while DAL and BLK will update the market on Thursday.
Simply looking at the JPM 30d IVX, we can see that market makers have pushed implied volatilities in single stocks higher but that has been a broad-based scenario.