30d IVX breaks the key 30% level
October 12, 2022
Stock indices continued to drift lower yesterday with the SPX finishing 0.6% lower and the NDX closing 1.25% lower.
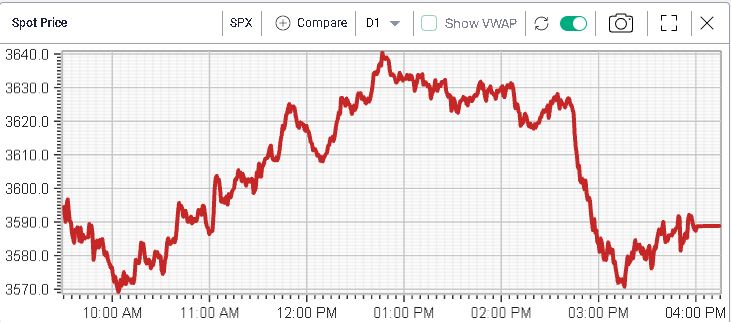
Intraday volatility remained decent enough with the SPX trading rallying around 70 points from the opening lows before visiting 3570 again around the close.
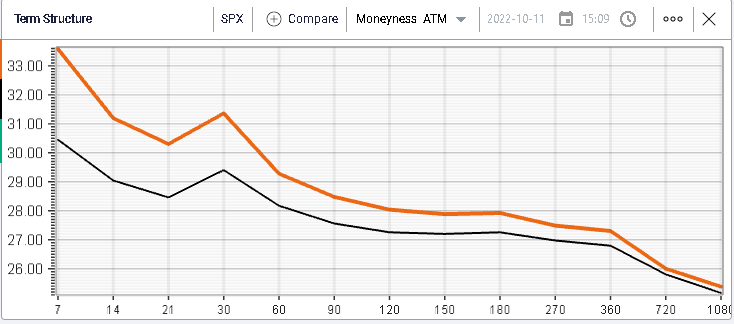
Looking at implied volatility, all points on the term structure moved higher yesterday with the 30d term gaining around 2 points over the day.
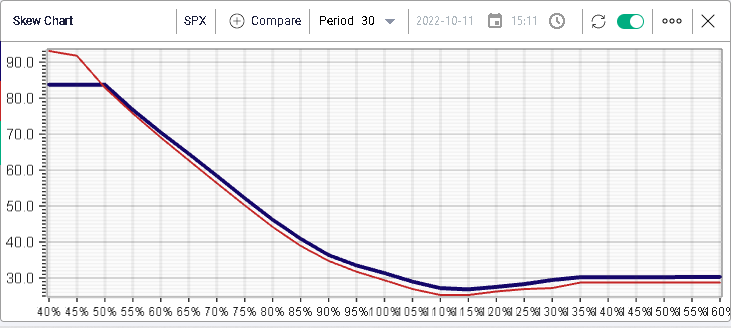
Looking at skew, we can see that it roughly parallel shifted higher for the 30 days bucket.
Zooming out and looking at the historical 30 days implied volatility index, it has finally closed above 30% with a closing value around 30.75%.
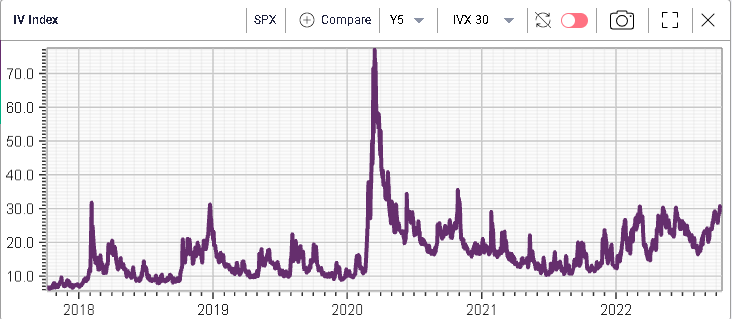
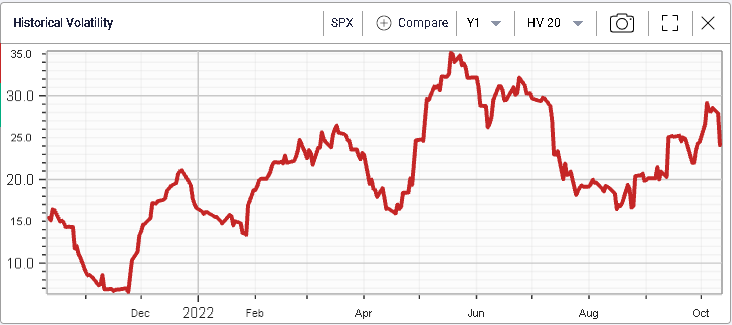
This shows that market makers remain nervous about the possibility of large moves in either direction despite an apparent drop in realized volatility as evidenced on the below chart.
As discussed in yesterday’s note, the market’s attention will likely shift to single stock stories over the next few weeks and we will try to discuss those in upcoming market updates.