JPM continues to bounce while focus shifts to single stocks.
October 18, 2022
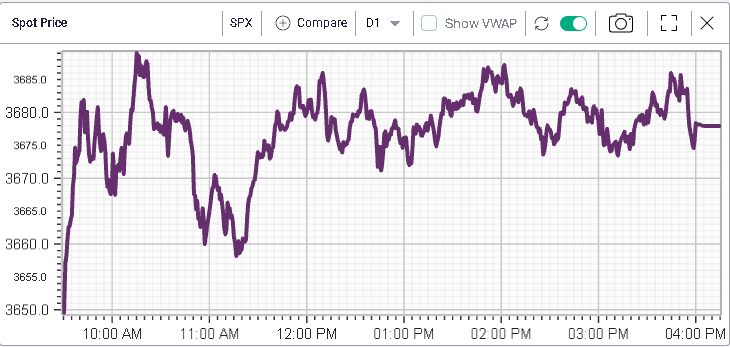
Equity markets bounced nicely to start the week with the SPX gaining 2.65%, the NDX 3.46% and the DJIA 1.86%.
Considering the strong price action, one would easily have expected implied volatilities to remark significantly lower over the session but this as not really the case.
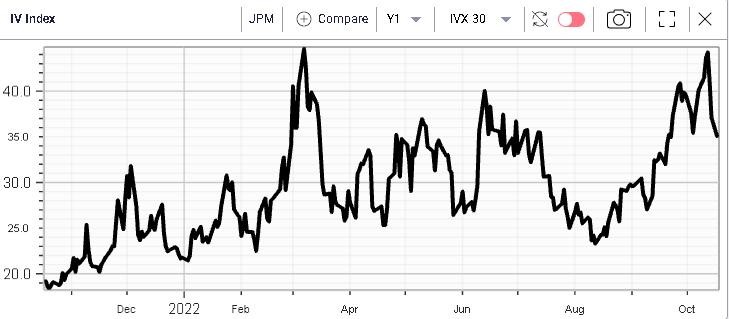
As shown on the below 30d IVX chart, implied volatilities remained firm throughout the session with little sign that options market makers were willing to reprice IV cheaper.
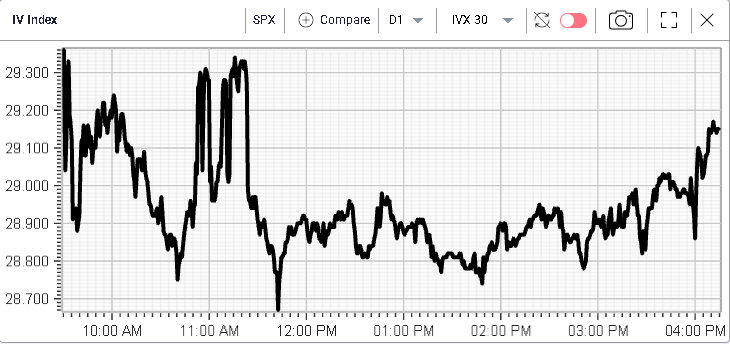
Compared with Friday’s close, the vol remark thus looks fairly marginal with 30d IVX losing around 0.3% over the day.
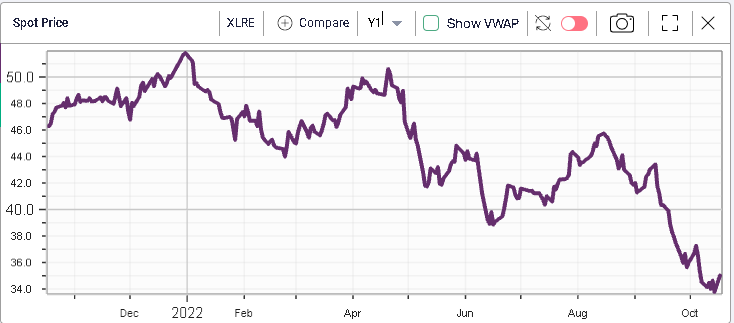
Looking at the sectors over the day, all of them finished in the green with Consumer Discretionary and Real Estate leading over the session. Both sectors have been under significant pressure in 2022 as shown below.
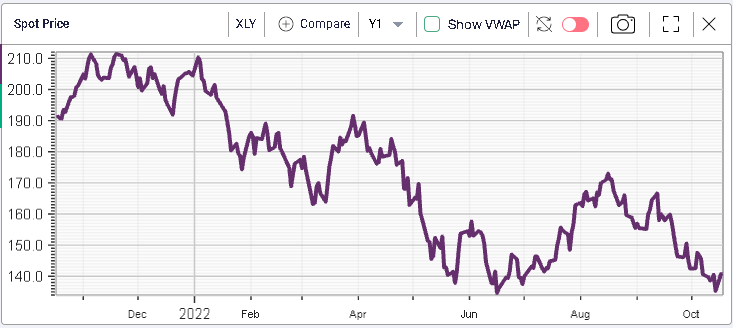
At the bottom of the performance charts are sectors like the Energy segment and the Consumer Staples which were up around 1% on the day.
Looking at the DJIA components, we note that JPM continues its strong bounce that started just before earnings last week.
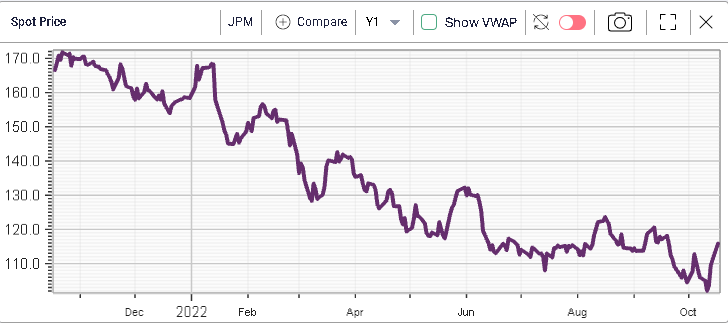
The stock has gained more than 13% in the last 5 sessions but implied volatility has stayed elevated historically as shown on the below 30d IVX chart.
Call volumes over the past few days have been fairly elevated in the name as seen below and it will remain interesting to see how things evolve over the next few days.
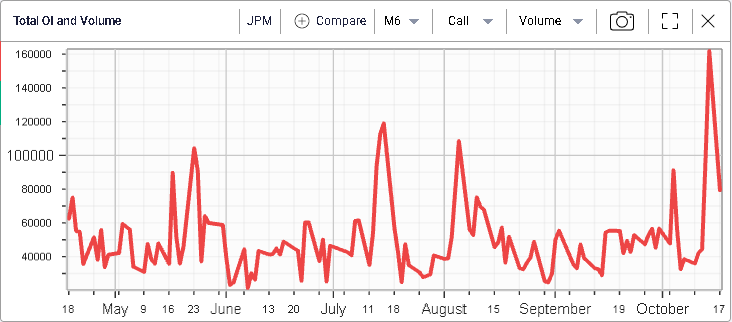
Looking at the most active options in the name yesterday, we note that the 115 calls for Friday’s expiration traded around 7,000 times while the 120 calls traded around 6,600. We also saw around 3.4k of the 120 calls with expiration 2022-10-28.
Puts that traded in decent size include 4.6k of the 105 puts with expiration 18th Nov’22 and around 4.5k of the 115 puts with expiration Friday.
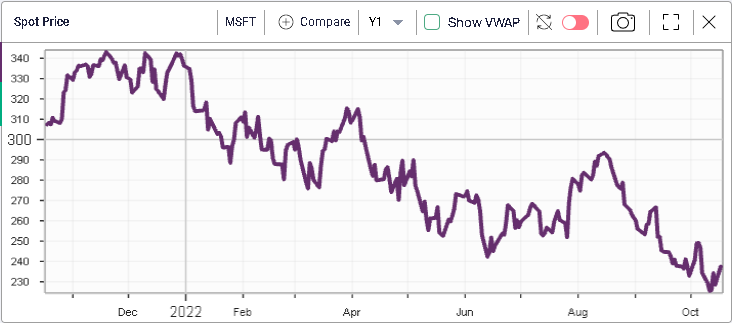
MSFT, another name that has struggled in 2022 (-29% YTD) was seen bouncing yesterday with a gain of almost 4% over the course of the session.
All in all, it is important to remember that earnings season is a good excuse for market participants to recalibrate their portfolios. As management updates the market about the past performance and future prospects of their firms and industries, some stocks may suddenly look either too rich or too cheap offering great entry points for those who are able to track them.
Using options is also a way to pre-position for such outcomes and that may explain to increase of attention towards single stock options over the past few weeks.