Not just about fundamentals
October 19, 2022
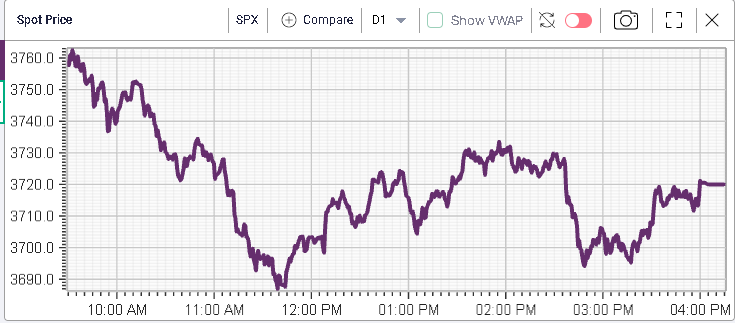
Markets continued their bounce yesterday with 3700 on the SPX starting to act as a strong local support for bulls.
Implied volatilities deflated further on Tuesday with 30d IVX dropping around 0.5%.
In the next few market updates, we want to look into the moves seen over the past 10 days to look at the broader picture of sectors and stocks that seem to have done well.
First in today’s newsletter, we will be looking at indices. In that segment, it seems fair to say that we have not achieved much over the past 2 weeks. US indices have been slightly under pressure with the NDX losing around 4% while the SPX dropped around 2% but not everything seems bad as the DJIA gained around 0.5% in the same period.
The biggest loser has undoubtably been the Chinese market with the HSCEI losing around 8% over the past 10 days (see Monday’s note) while Europe managed to hold on and make slight gains with the French CAC up around 0.3% and the German DAX higher by close to 0.4%.
This overall picture also seems to contrast with the mood in the market. Reading the financial press, it seems that participants have turned very bearish while in reality, there also seems to have been some buying happening under the surface. To some extent, we have seen slow drifts higher for stocks (possibly related to participants buying) while the macro news came as a headwind and forced a fast repricing lower of risk assets.
That seems to be the fight happening at the moment in the market that sees SPX stuck in a 3600-3800 range for the time being.
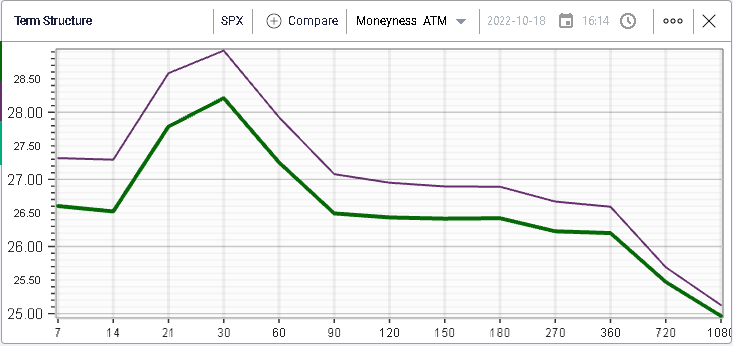
The same is generally true for volatility. For US indices, IV has remarked higher, most likely forced by the overall negative performance of stocks. The below term structure chart shows that the 30d IVX has moved from 26 to around 28 in those 10 days.
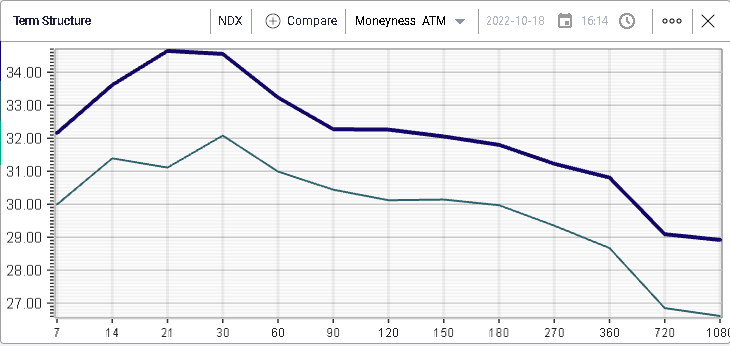
For the NDX the picture is fairly similar as seen below with 30d IVX moving from 32 to around 34.5 in 2 weeks.
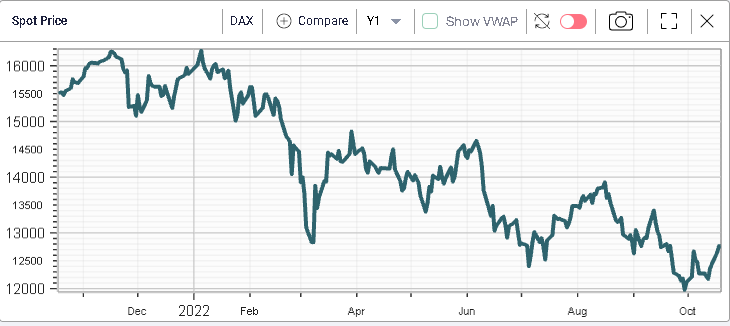
Over in Europe, the same picture emerges on spot with the German DAX bouncing off the psychologically relevant 12,000 level.
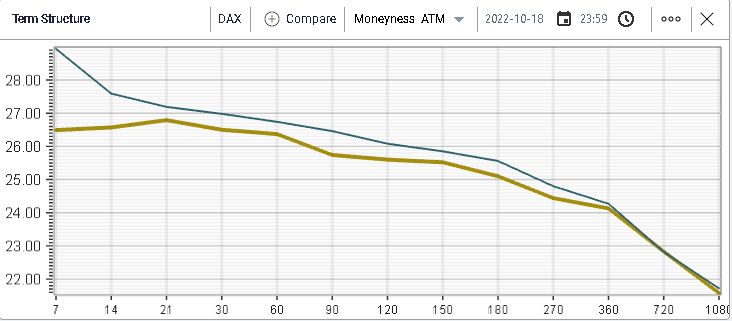
Looking at IV, we see a fairly different picture from the one seen in the US with 30d IVX for the DAX losing almost 1 point over the course of the last 10 days.
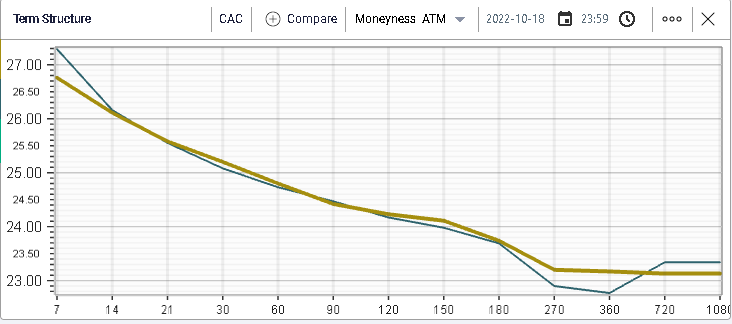
For the French CAC, the term structure is largely unchanged over the period.
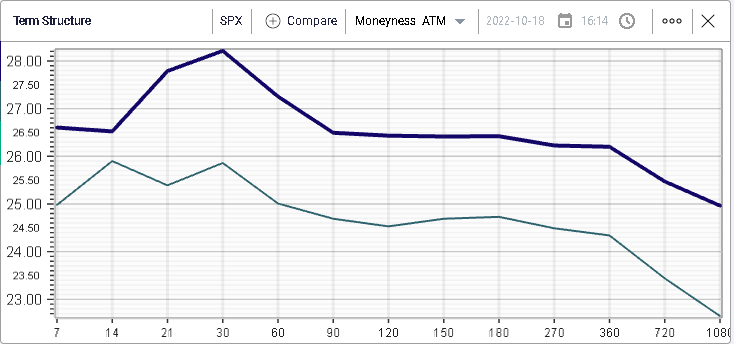
This divergence between EU and US implied volatilities creates an interesting situation where SPX 30d IVX (yellow line below) is now trading at a premium to the DAX (red line below), a rare phenomenon when looking at the last 12 months of history.
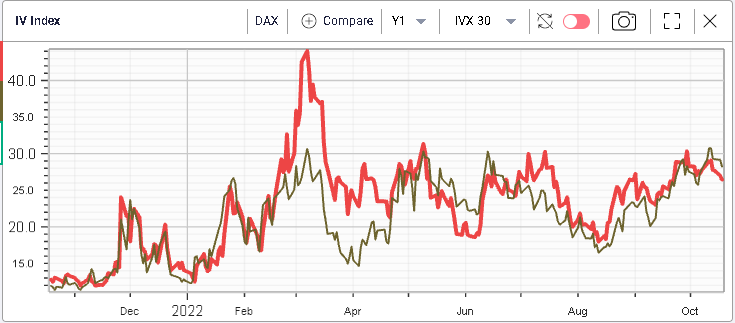
We also see the importance of the 30% mark for EU and US 30d IVX over the past year.
It is interesting that option market makers and directional traders seem to take a different view on the US and EU markets. Despite all the worries surrounding European markets, it seems that they have found a way to outperform their US counterparts this year, something that would have seemed impossible back in Q1 when geopolitical tensions were rising.
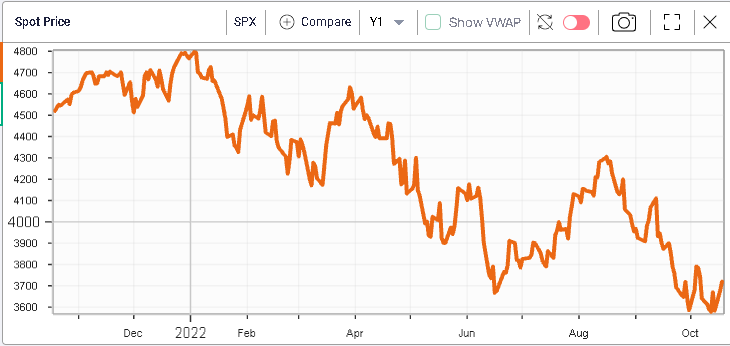
Nonetheless, the French CAC has lost 15.65% so far this year, the German DAX is down around 20.3%, the SPX has dropped 22.44% and the NDX 32.45%.
This probably also shows that, there is more to this selloff than simply fundamentals which would have most likely dictated that Europe underperformed. To some degree, the underperformance of US indices could also be related to excessive market positioning in the region.