Some gained a lot and others lost
October 21, 2022
Going into today’s expiration, US equity indices remained fairly subdued with the SPX losing 0.8%, the NDX dropping 0.5% and the DJIA finishing 0.3% lower. Intraday, moves were decent with a high/low range of around 70 points.
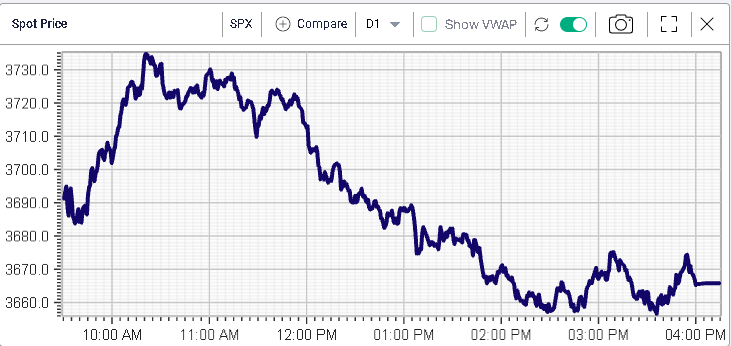
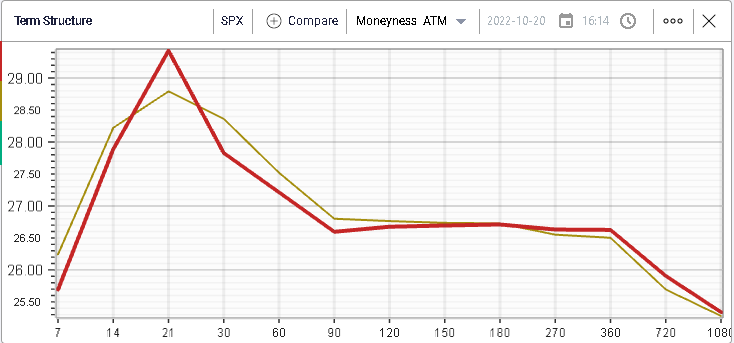
This may explain why implied volatility was relatively sticky with 30d IVX losing 0.5% to settle slightly below 28.
In today’s market update, we want to look into the moves over the past 10 days for some stocks in Europe and the US. Yesterday’s analysis at the sector level showed how divergences between European and US segments could be noted, in particular for banks.
Let us start in Europe where we have had some fairly significant moves over the past 10 days for individual stocks even though our prior analysis at the index level showed a relatively limited volatility.
For instance, PHIA a medical technology company based in the Netherlands and with a market cap of around 12bln euros at time of writing has lost more than 15% in the past 10 days.
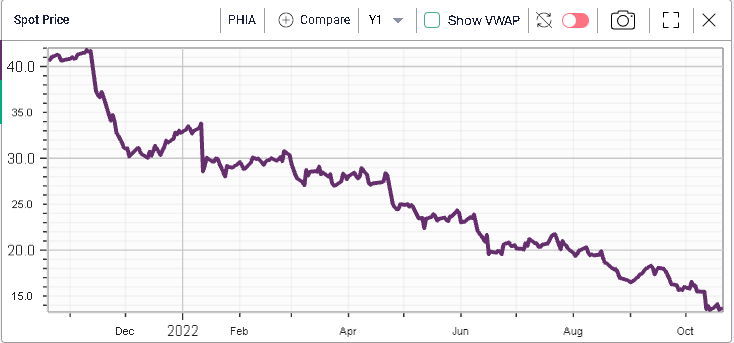
Zooming out as seen above, the stock has been under heavy selling pressure over the past 12 months and has lost 60% YTD and 67.4% over the last year.
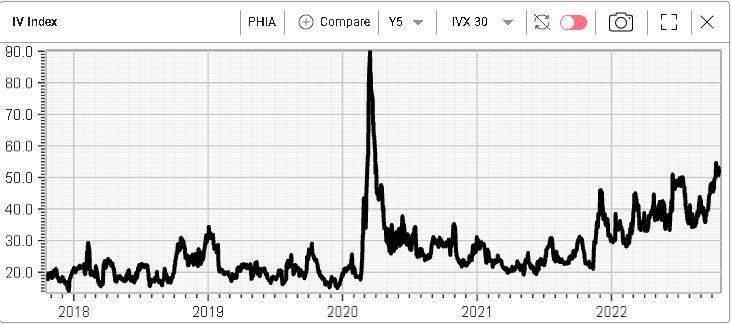
Implied volatility has moved higher and now trades above 50% at its highest level since the pandemic.
On the upside, we note the strong performance of BAS, the largest chemical producer in the world according to Wikipedia, which has gained more than 10% in the past 10 days.
The stock had been under pressure for the main part of 2022 but seems to have found a strong support around the 40 euros mark and is now trading at the top end of the last 3 months range.
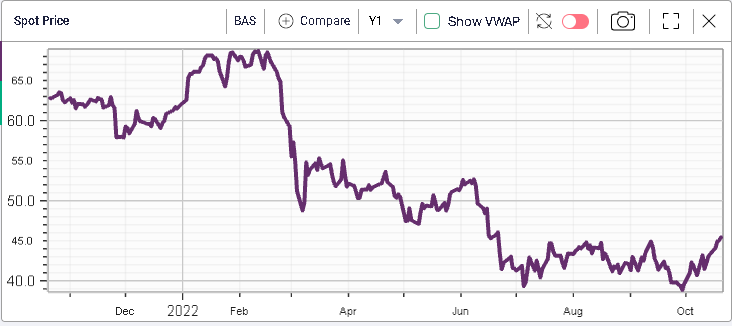
Looking at implied volatility, we can see that options traders have welcomed the most recent price action in the name pushing 30d IVX below 40 in the name.

Looking over to the US, we also find a high degree of variability in the performance of underlying stocks. For instance, we find companies like BIDU which have lost almost 25% in the past 10 days.
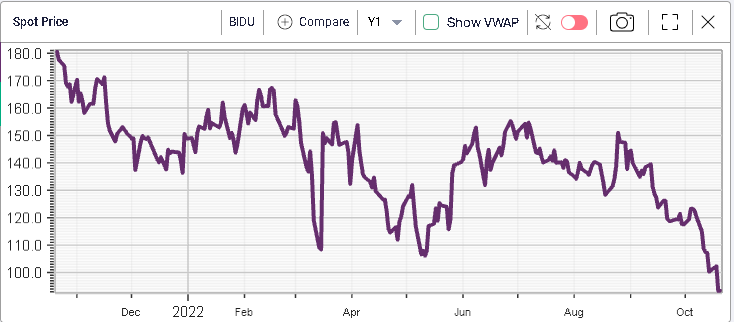
On Wednesday, we saw that Chinese companies were affected by multiple factors ranging from a strict zero COVID policy to changes in legislation in the US.
In BIDU, options traders are concerned with an IV around 67% but relative to where it has been in 2022, it seems that they are getting more comfortable with the risk and the uncertainty associated with the name as implied volatility has failed to make new highs while spot prices have continued to move down.
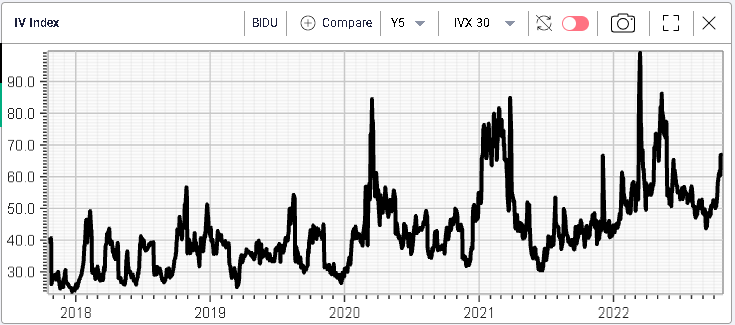
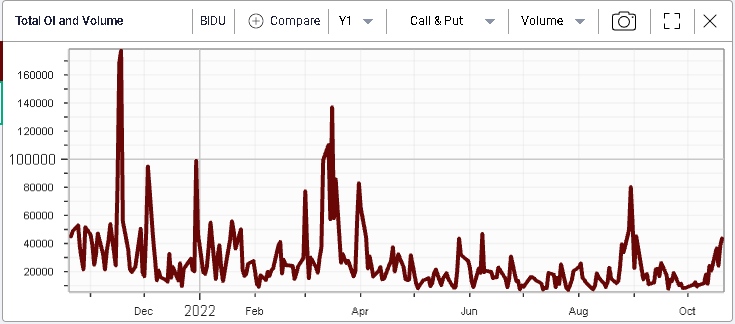
As calls and puts volumes are increasing in the name, it will be interesting to see the evolution of implied volatility and spot over the next few days.
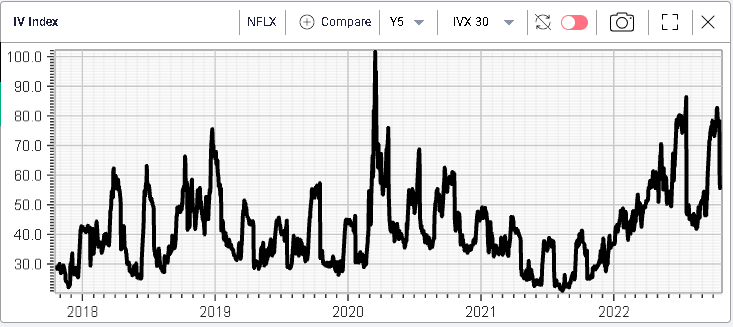
On the upside, we note the performance of NFLX which has gained around 12% in the past 10 days. The stock has managed to halt its slide in the middle of the year and following its recent earnings release it has started moving upwards again.
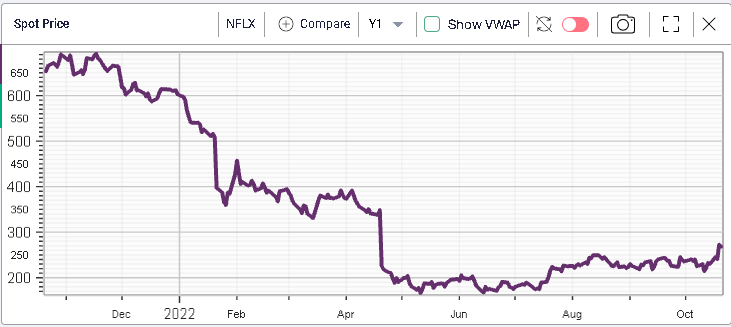
Implied volatility has moved lower following the recent number releases and is now trading around 55%.
There are many names that could be studied and flagged, in particular in the US. We shortlist a few below for the reader to study:
- MRVL -20.6%
- TEAM -19.4%
- NTES -19%
- JD -18%
- ZS -17.8%
- PTON -16%
- ISRG +7.3%
- AMGN +7.14%
- KHC +5.75%
All in all, this shows how zooming out can provide some true benefit for traders in assessing the trends that are happening in the market. Indices do not always give the full picture as they are meant to give an average view of the market. An index pointing to a small down performance might well be hiding stocks losing a lot while others gained a lot.