TLT puts trade, looking for another 1.6% move higher in 20y yields?
October 24, 2022
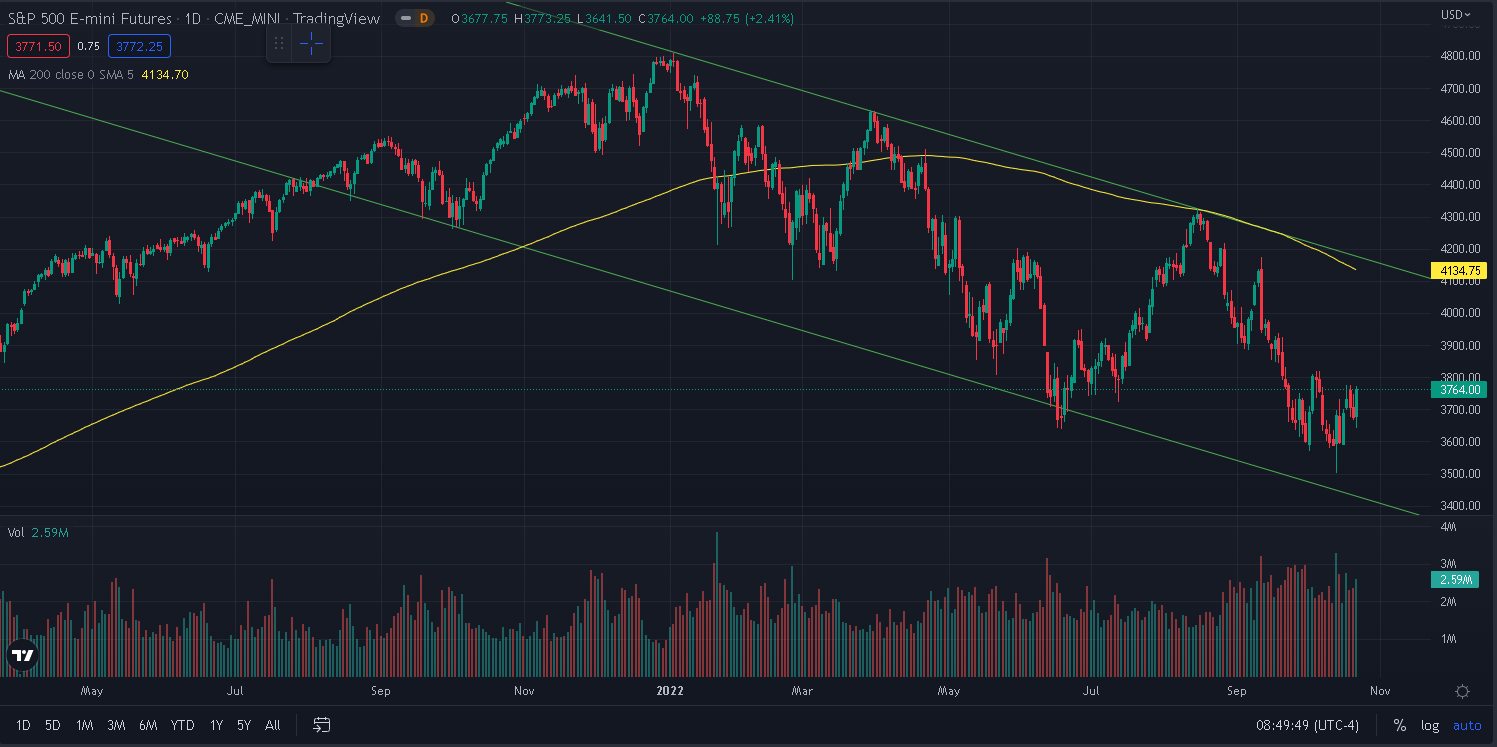
Stocks bounced over the past week and the low point made around the last inflation numbers in the US has proved to be extremely significant so far for market participants. The overall trend judged on the daily timeframe below remains bearish for now but some short-term price action seen over the past week has been generally welcomed by bulls.
Source: Tradingview.com
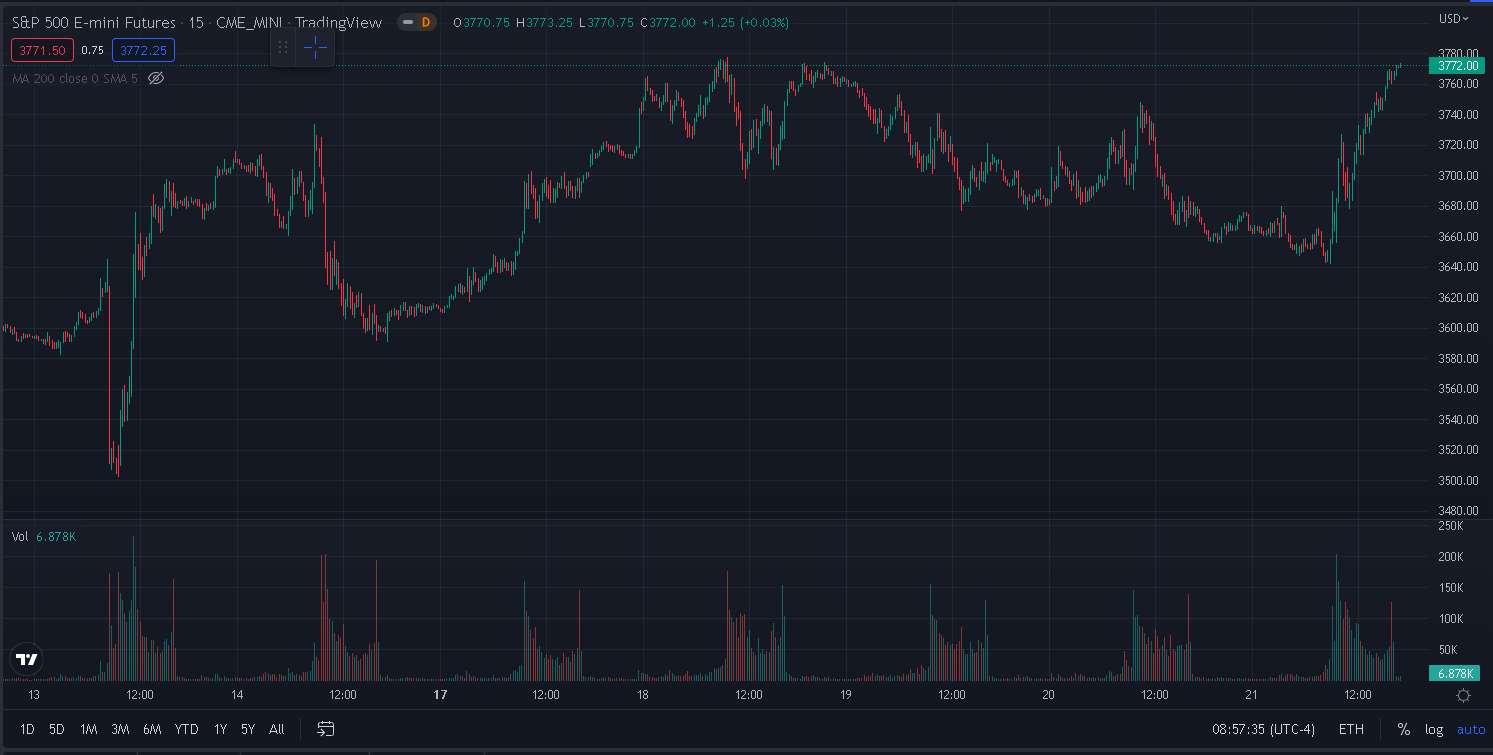
The below 15 minutes chart displays how significant the 13th Oct’22 bottom has been. Despite several attempts by bears to push prices back down they have been unable to retest that level. This overall price action seems to have provided bulls with a new pivotal area around 3500 on ES above which they seem to take comfort in the fact that a strong bottom is in place.
Overall, the NDX gained around 6% over the past week, the SPX and the DJIA slightly more than 4%.
Europe lagged slightly gaining around 2% while Asian Equity Indices remained under pressure with the HSCEI finishing around 2% in the red.
The best performing sector for the week was the energy segment that gained more than 8%. In the below chart, we display the performance of the Energy sector in the US compared with that of USO, an ETF tracking the price of Crude Oil.
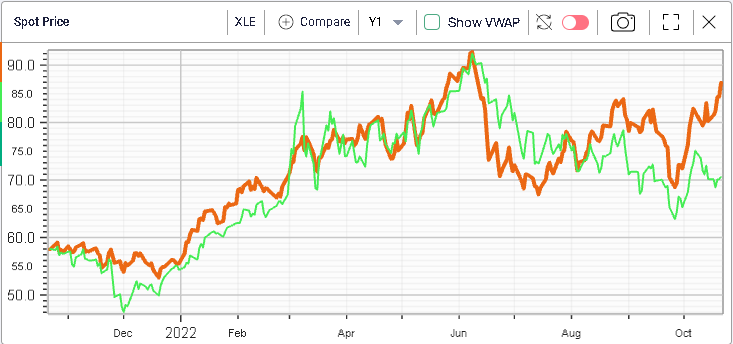
We can see that the energy equities have significantly outperformed the underlying commodities over the past few weeks.
It seems that going into earnings, traders took a more positive view of those stocks and on Friday, Schlumberger released a set of numbers that were ahead of the street’s expectations. Reuters reported that those numbers were the strongest since 2015 for the company.
With upcoming earnings from the rest of the sector, we can probably explain some of the outperformance of those Energy names over the past week.
Note that Schlumberger finished 10.4% higher on Friday and has now gained around 59% in 2022.
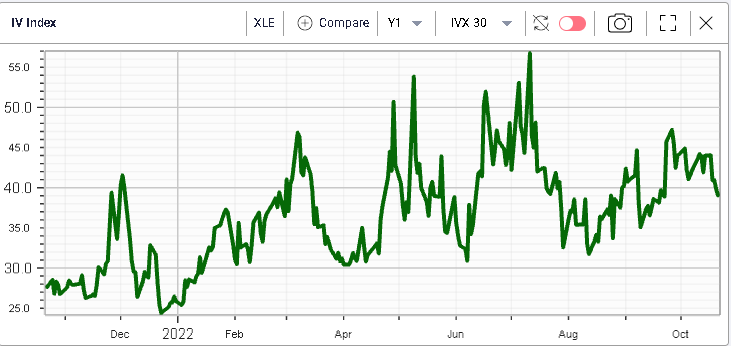
This volatility around earnings anticipated by market participants may well explain why implied volatility has remained fairly steady over the past few weeks across the Energy space. The below chart shows the 30d IVX for the sector which remains around 40%.
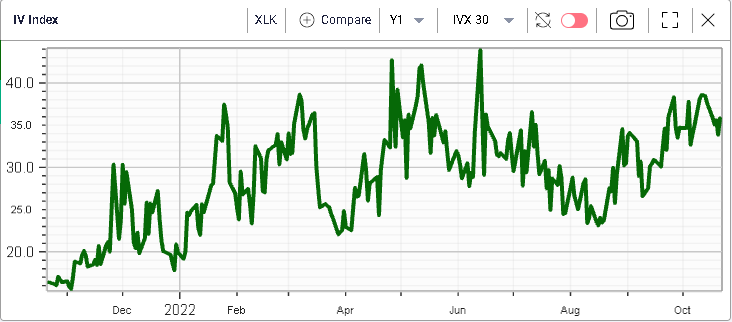
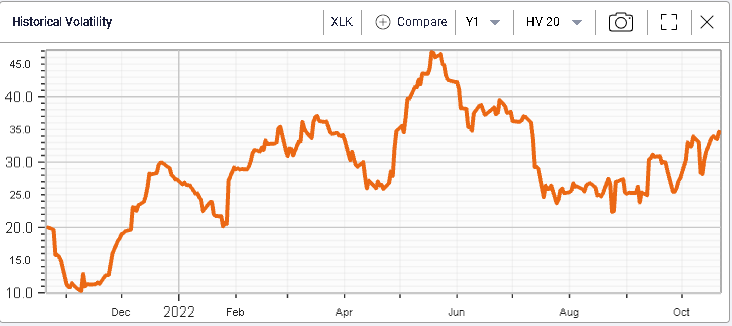
Tech stocks also had a good performance last week gaining more than 6%. Those names have been amongst the worst performers in 2022 so it is interesting to see them outperform alongside some of the best segments of the market. The below chart shows the Technology sector’s performance over the past 12 months, a loss of 29% YTD.

For those names as well, implied volatilities remain elevated historically, supported by rising realized volatility.
The themes in the markets have remained the same over the past week but on Friday, some FED speeches as well as media reports raised hopes that the hiking cycle might be nearing a pause.
Last week saw the market price a peak Fed Funds rate above 5% before paring it back to around 4.9% on Friday. 10-year US yields had been drifting higher to a level of around 4.34% before settling around 4.22% by Friday’s close.
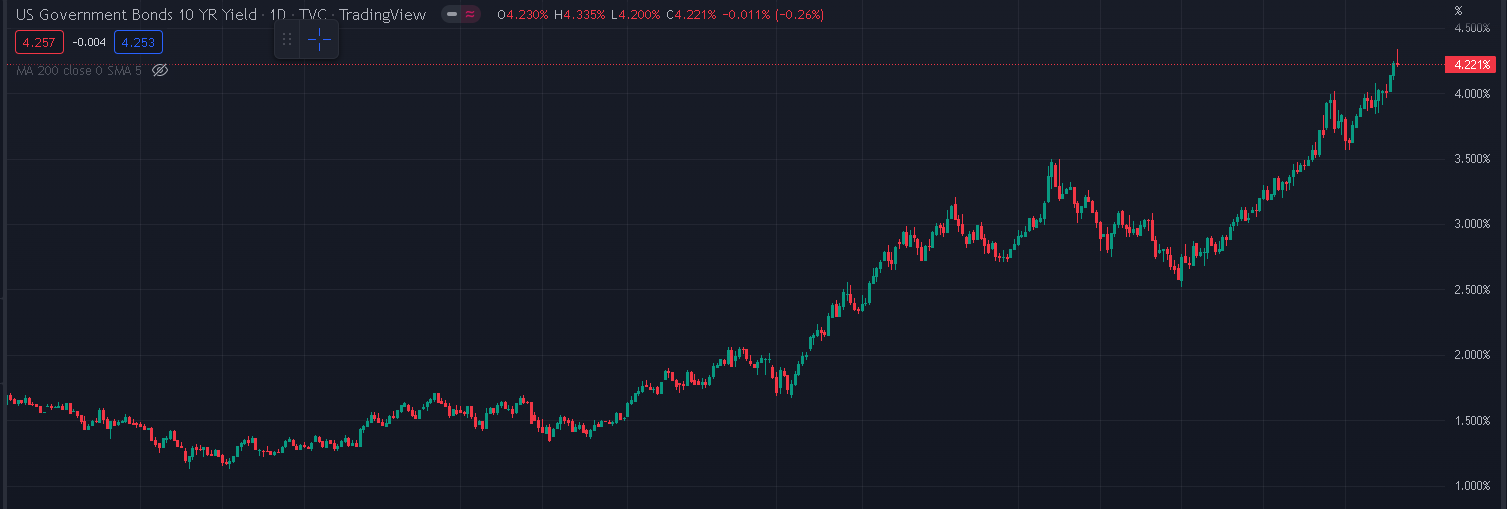
The recent developments in the UK highlight how quickly the market’s attention can shift from a focus on the fight of inflation to the sustainability of a country’s finances. It also drew a lot of questions around the liquidity of the underlying markets with some of the most traded bonds in the UK seeing intraday yield moves of around a full percentage point.
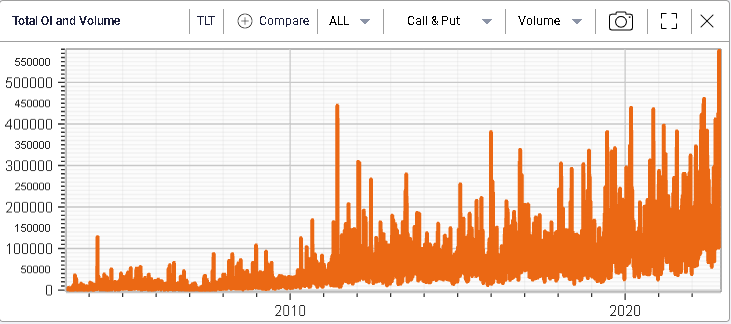
This leaves us with an implied volatility for the bond market that remains incredibly tense, at the highest level for 30d IVX on TLT since the pandemic.
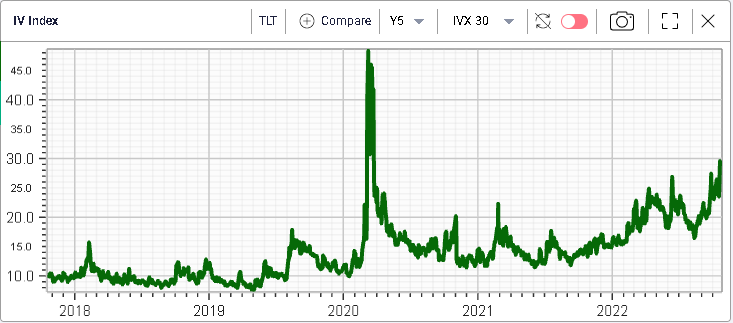
Importantly, Friday saw the largest volumes in the TLT options market since the launch of the ETF with 576k options exchanging hands.
On the put side, it was interesting to note that 47.5k of the 17th Mar’23 75 puts traded representing around 20% of the total volume in TLT puts and around 8% of the total volume.
Those represent a significant downside to current prices of $93 and could be linked to the view shared by market participants that the FED might have to do much more to calm inflation. To put this in context, if TLT was trading around $75 then the 20-year US treasury yield would be expected in the region of 6.2% compared with a current yield of around 4.59%.