Looking at Canadian equities ahead of the BoC Rate decision
October 26, 2022
US indices continued their rally yesterday with solid gains of +1.63% for the SPX, +2.1% for the NDX and +1.07% for the DJIA.
Implied volatilities drifted lower over the session losing around 1 point for the 30d IVX.
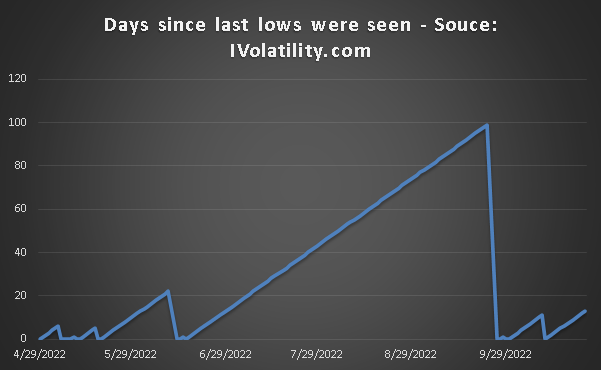
Tuesday was the third consecutive up day in the market and the last local lows (defined as a rolling 200d low) were seen 13 days ago.
The below chart shows the number of consecutive trading days that it took for the market to retake its prior lows.
The main event today will be the release at 10am EST of the Bank of Canada’s interest rate decision where the market is expecting a 0.75% rate hike to take interest rates to 4%.
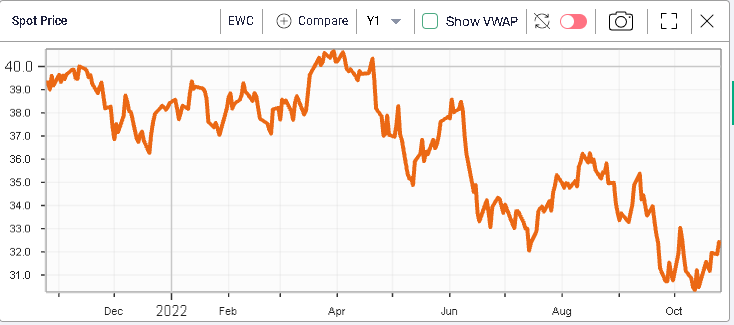
In January 2022, policy rates in Canada were seen at 0.25% and the EWC, an ETF tracking the MSCI Canada index has lost around 16% YTD.
Financials make up around 36% of the index while Energy is around 20%. Both sectors have managed to navigate the current situation relatively well. For instance, looking at the top 4 components of EWC we find:
- RBC - down 9.5% YTD
- TD - down 12% YTD
- ENB - up 4.74% YTD
- CNQ up 47.71% YTD
This explains why on the below chart from tradingview.com, we find that the SPX/TSX index has been the second-best performer amongst a group of US/EU/Asian indices with a YTD performance of -10%.
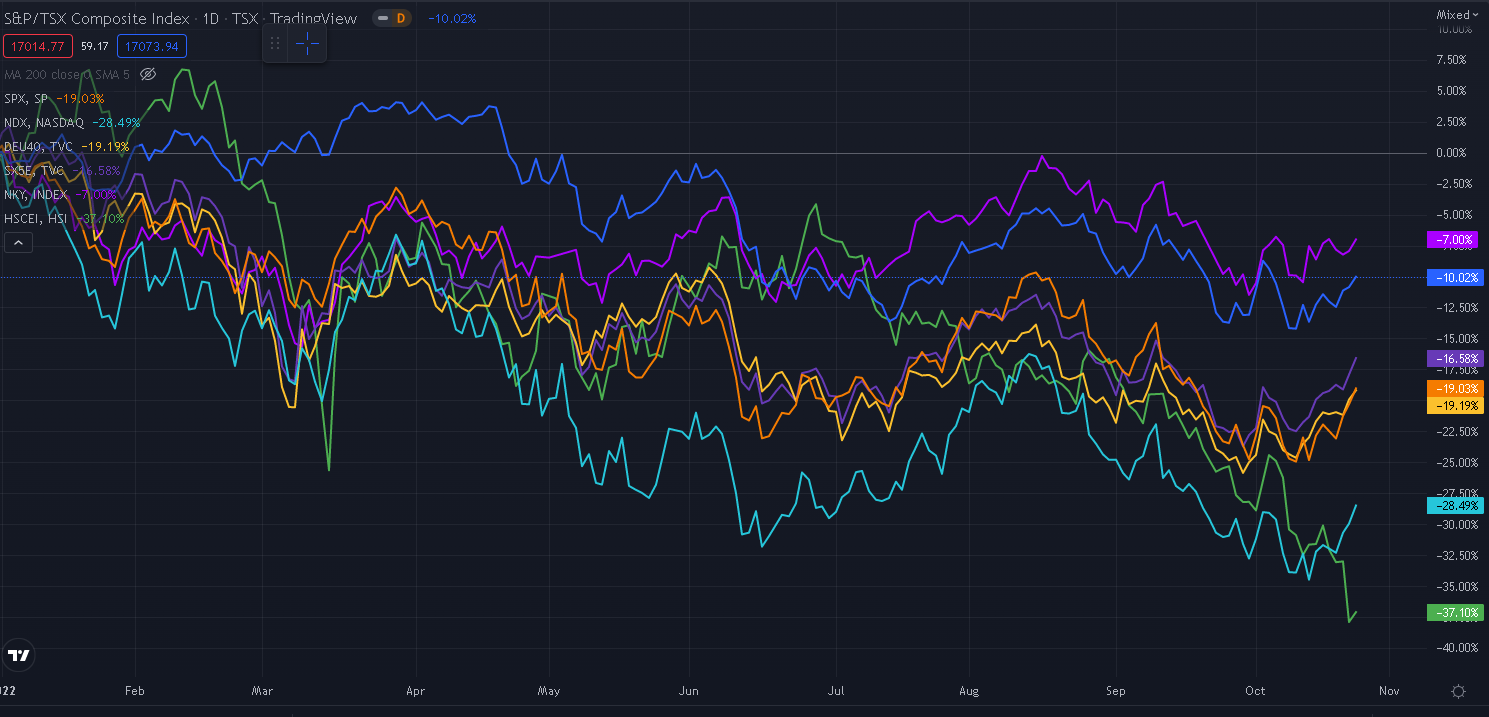
Bear in mind that the performance of the NKY is in large parts explained by the significant underperformance of the JPY as a currency with USDJPY up around 28% YTD. In the meantime, the performance of USDCAD has been +7.17%.
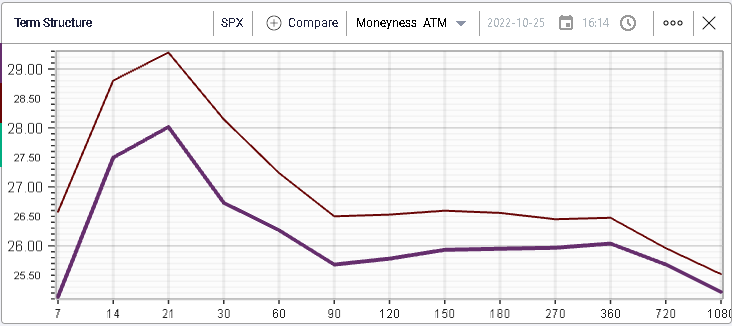
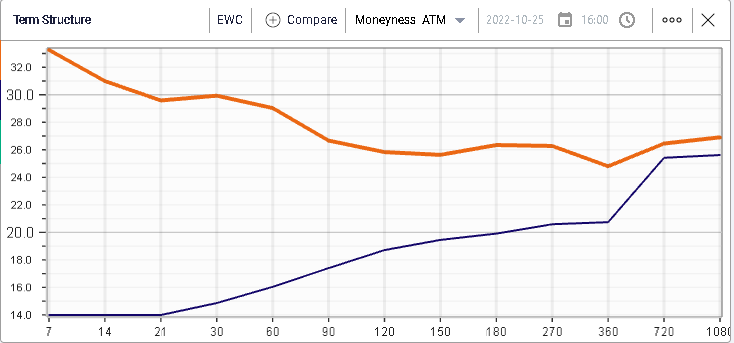
Despite this apparent outperformance, the EWC term structure has moved significantly higher in 2022 as seen on the below chart displaying in orange the curve as of the 25th Oct’22 and in blue the curve as of the 31st Dec’21.
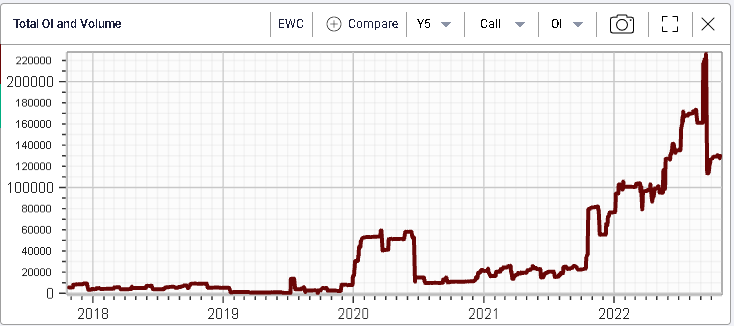
This could be related to the explosion of put activity on EWC as shown below with the OI hitting a peak of 1.4m contracts.
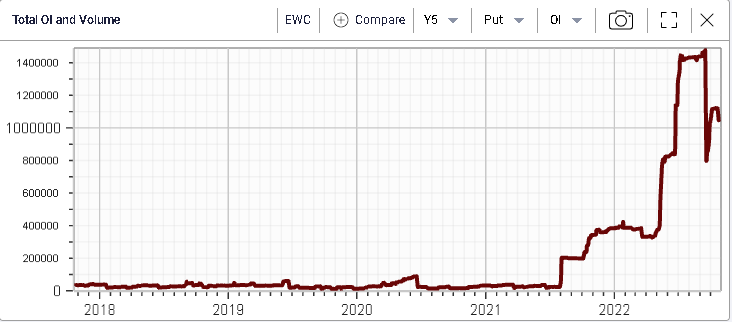
Call OI has increased but to a lesser extent with a peak of around 200k open contracts.