Important challenges ahead
October 31, 2022
The medium-term downtrend seen on US equity indices has remained in place for the time being but as discussed in prior market updates, bulls have gained a lot of confidence from the bottom made on the 13th Oct’22 with a pivotal low around 3500.
The SPX stopped on Friday right around the key 3920 level which has played a meaningful role in the past halting selloffs and capping prior attempts to bounce.
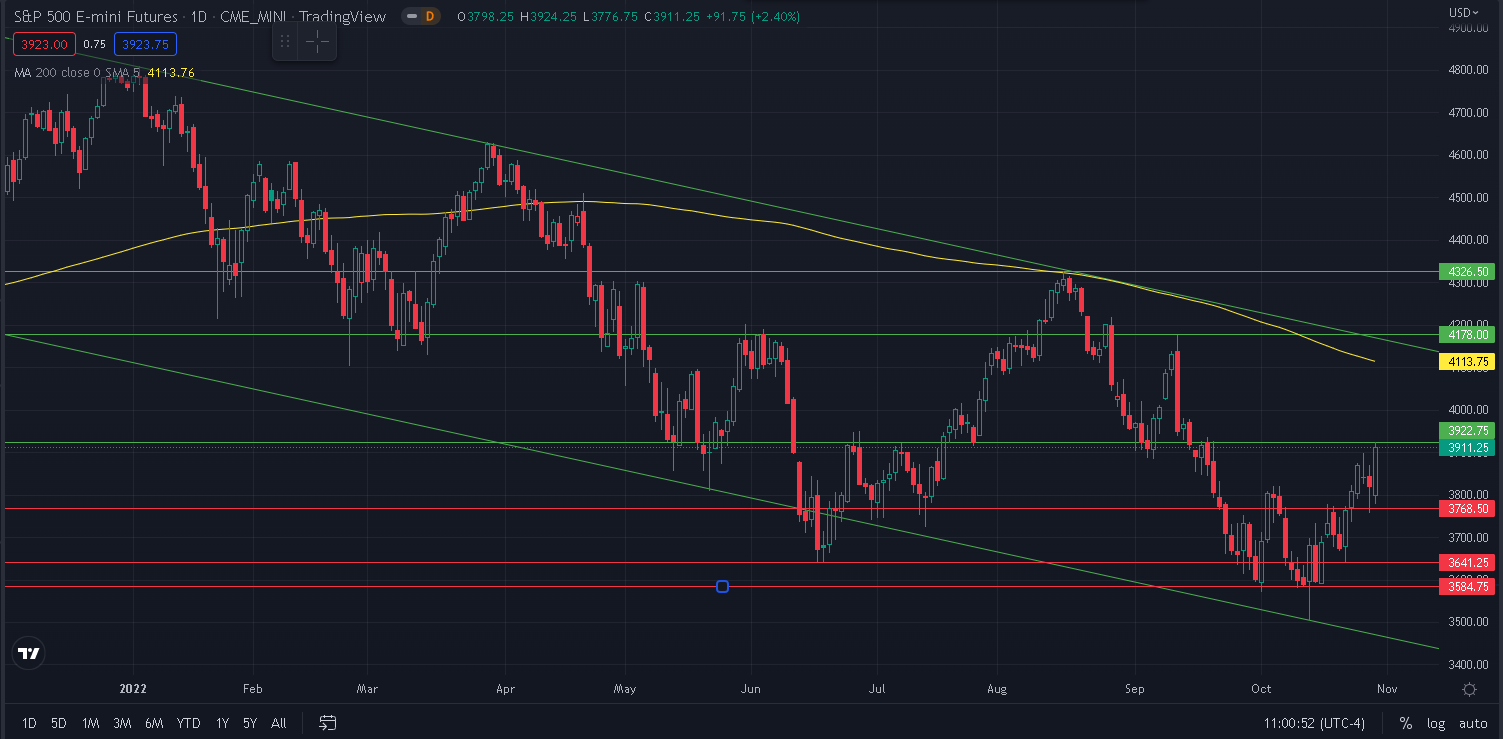
Source: Tradingview.com
On the upside, important levels are expected around 4178 and 4327 while on the downside, the above graph highlights 3768 - 3641 and 3584.
For the NDX, the pace of the selloff seems to have slowed compared to what was seen in the first half of the year as we have not tested the bottom end of the downtrend since June.
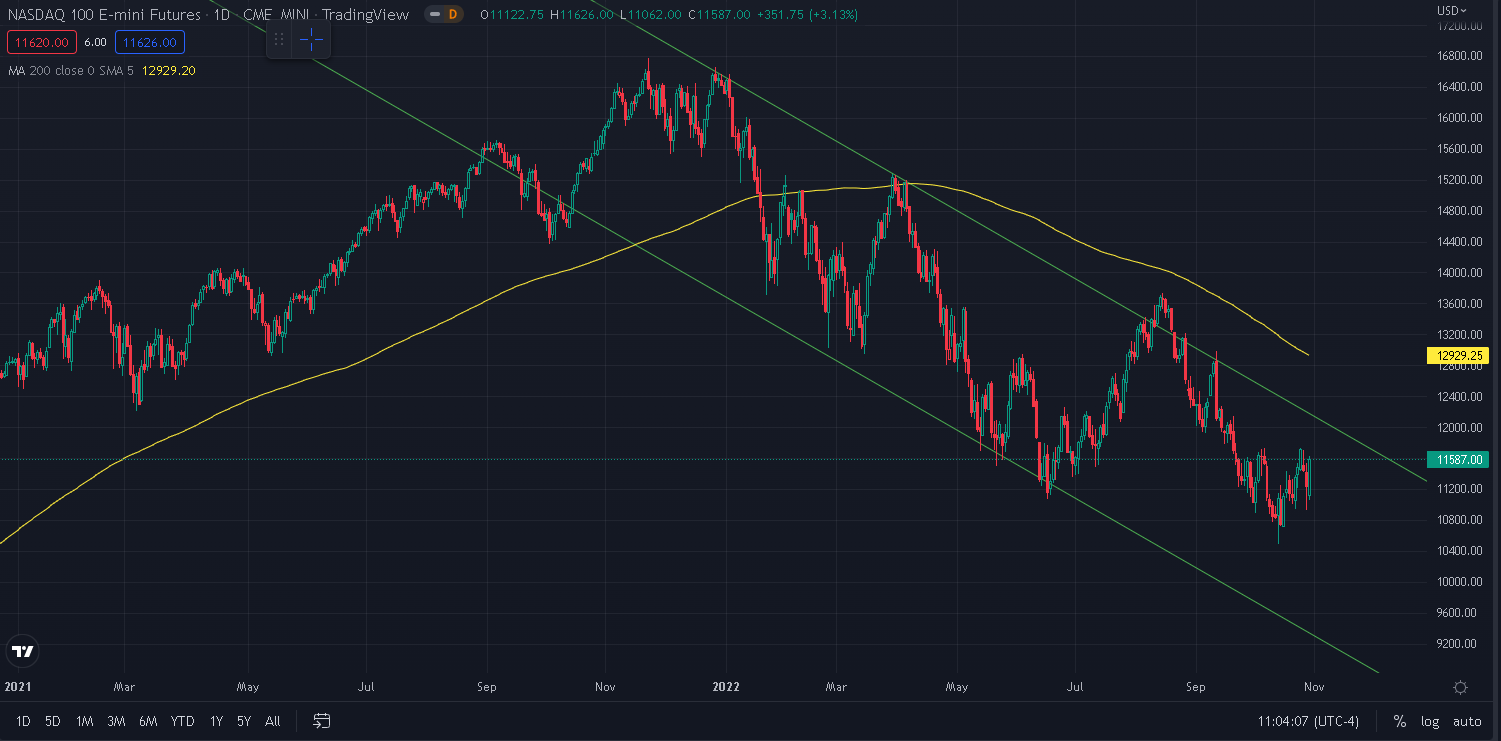
Source: Tradingview.com
For the German DAX seen below, we see that the index is now attacking the upper-end of the downtrend established in 2022. As seen in Feb/Mar, the market can easily overshoot and market commentators have so far remained cautious around the significance of such a break-out.
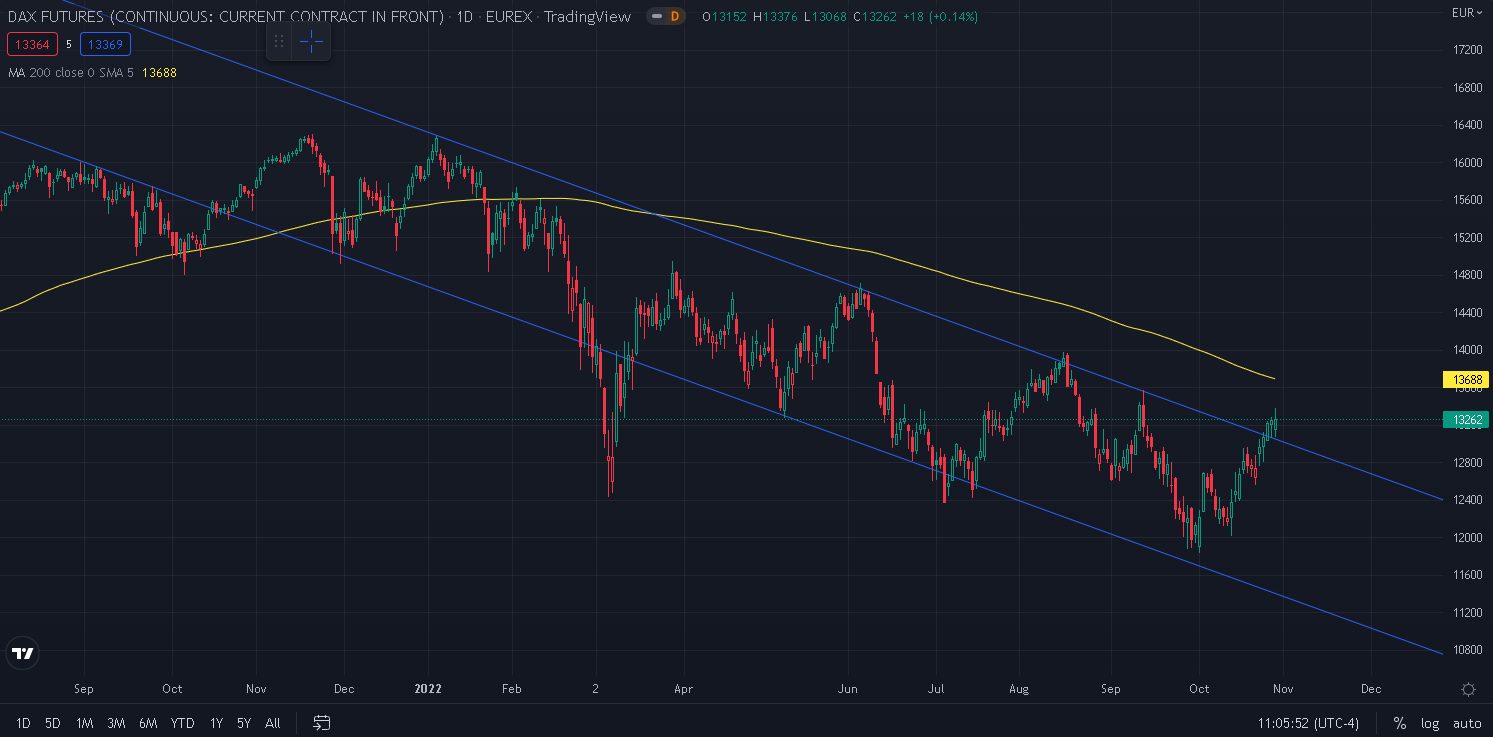
Source: Tradingview.com
Nonetheless, European equities have shown a high degree of resilience in the face of all that has happened in 2022 and the recent 12% bounce of the DAX from its recent lows is larger than the 10% seen for the NDX and equates the bounce seen in the SPX.
For the French CAC, we are seeing key resistance levels ahead with the 200 days moving average seen around 6345 and the upper-end of the 2022 slightly above.
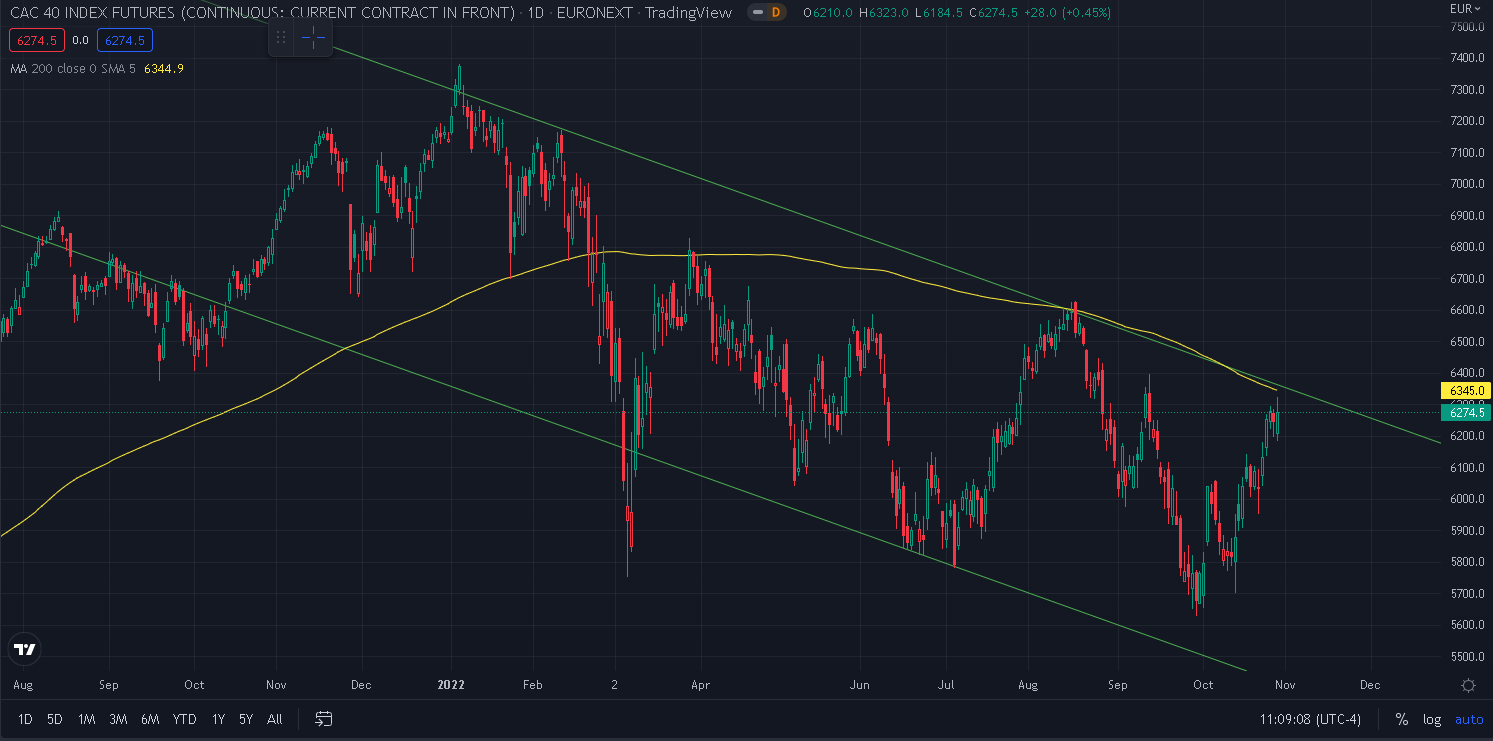
Source: Tradingview.com
Looking at Chinese Futures, we can see that they have accelerated on the downside over the past week. We have highlighted the selloff on multiple occasions in prior market updates and we now see that since July, the Hang Seng has lost around 35%.
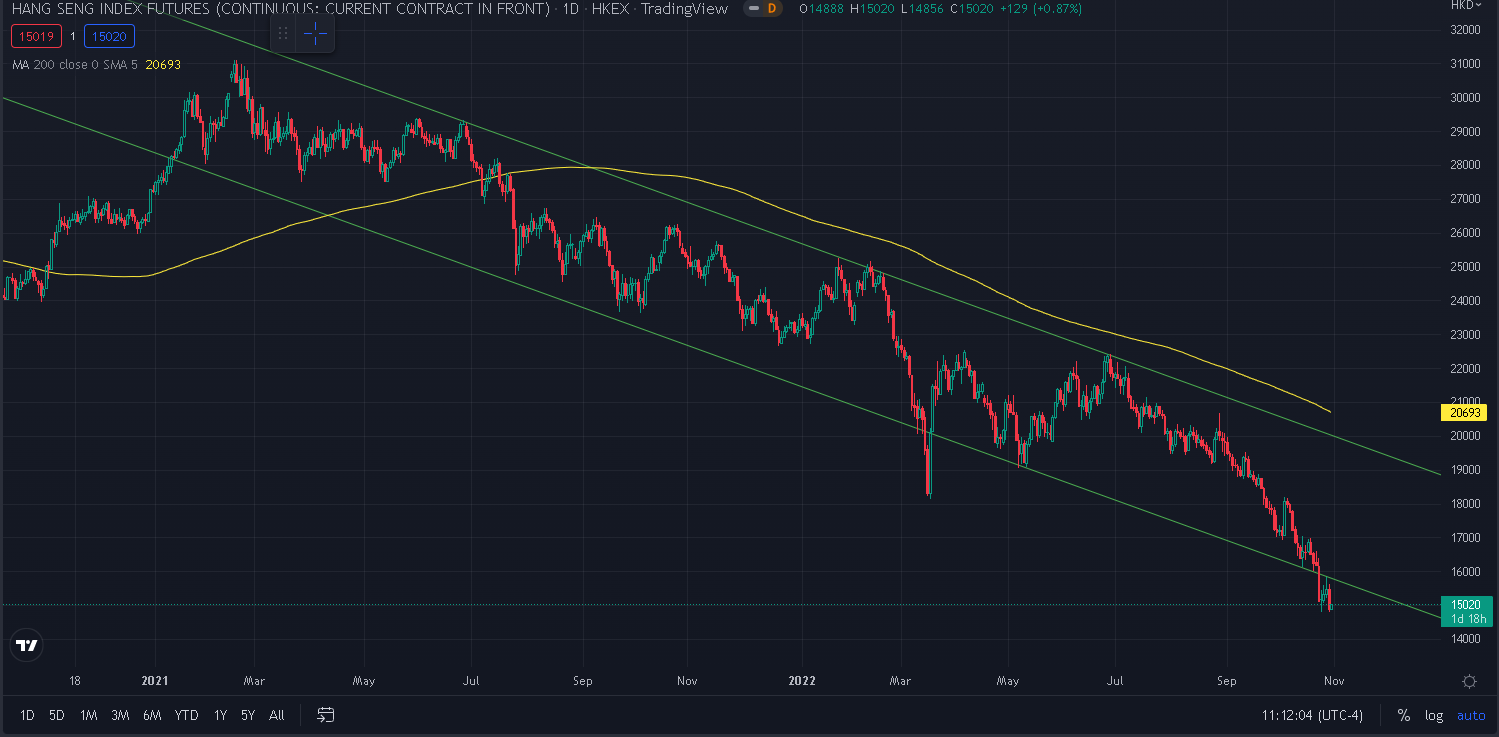
Source: Tradingview.com
To sum-up, last week saw a decent continuation of the bounce in most equity Indices except in China where we saw a continuation of the sell-off. The HSCEI lost around 9% over the past 5 sessions.
The DJIA outperformed its peers over the week gaining almost 6% while the German DAX, the SPX and the French CAC gained around 4%. The NDX and the NKY trailed gaining respectively 2% and 0.5% over the week.
Implied volatilities generally dropped over the week as seen on the below chart comparing in red the term structure of the SPX as of Friday and in blue the term structure of the SPX as of the 21st Oct’22.
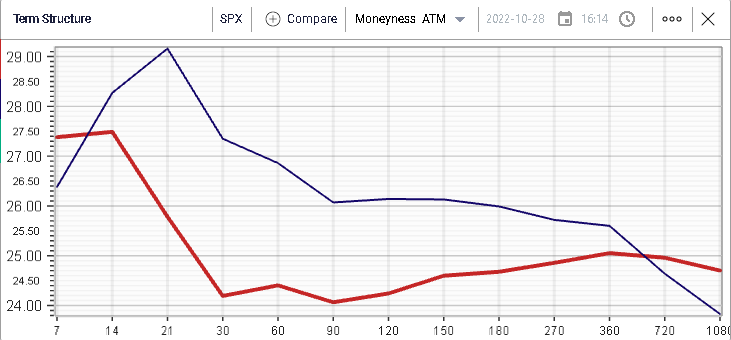
Implied volatility for the next 30 days dropped around 3 points over the week and is now expected around 24%.
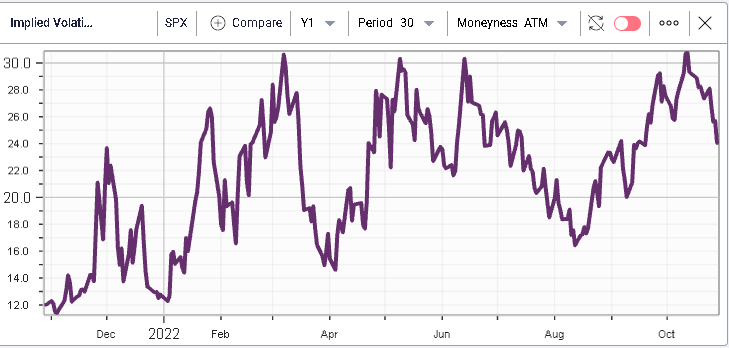
This highlights once again the importance of the 30% mark for 30d IVX which has played a significant pivotal role over the past year.
As the earnings season unfolds the update from US companies has highlighted that the strong USD is expected to be a major headwind in the near future. Below, we show a chart of UUP, an ETF exposed to the USD against major other currencies. UUP has gained around 15.5% in 2022 alone.
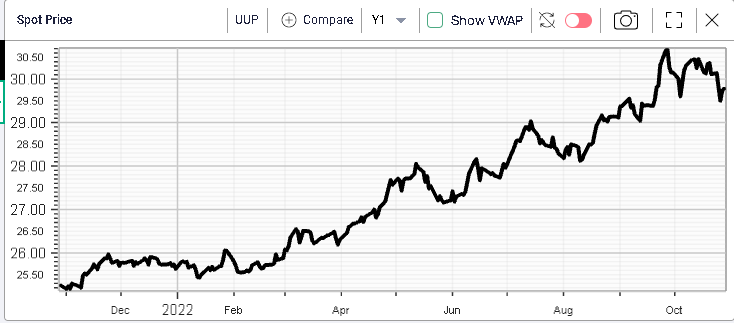
The broader implications of such a repricing of the world’s reserve currency have probably not been fully assessed yet. For instance, for many emerging markets, a decent portion of their debt is denominated in USD while revenues are mostly generated in local currency. This imbalance could lead to some difficulty for those countries down the road.
A study by the St Louis FED in Aug’21 showed that in Argentina more than half of the debt was denominated in USD. In Colombia, that number is around 30% while it is around 15% for Mexico.
Furthermore, as many goods are traded in USD, an increase of the base currency translates into an outsized increase of commodity prices. A recent article by the New York Times highlighted the large risks for emerging markets due to currency effects.
The EEM ETF which tracks the MSCI Emerging Market index has lost around 30% in 2022 and is getting closer to the lows seen in the midst of the 2020 pandemic.