Zooming out before the FOMC
November 2, 2022
Today we will get one of the most anticipated FOMC meeting of the year with traders expecting a 0.75% rate hike to take short term interest rates to 4%.
Over the past few weeks, market discussions have centered around the possibility of a pivot by the FOMC either at the November or at the December meeting.
In today’s market update, we want to take some time to study how assets have reacted over the past few weeks going into today’s meeting.
Fixed Income
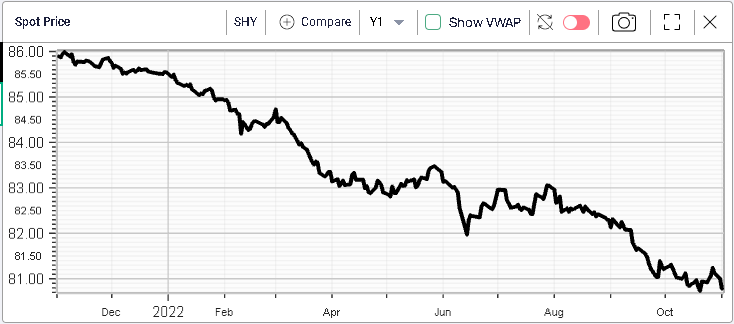
Short bonds proxied here by the US ETF SHY are at their lowest level of the year with the 2-year US Treasuries trading with a yield of 4.55%.
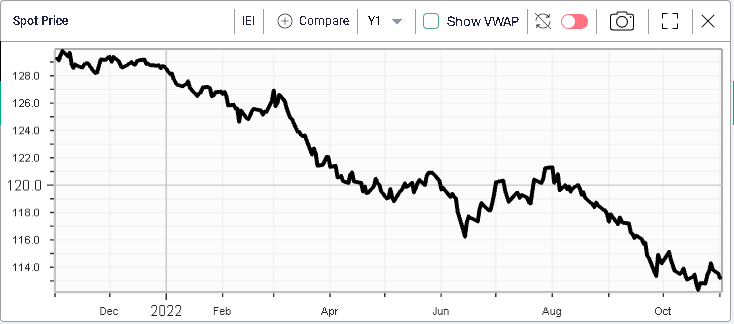
Intermediate bonds have rallied a little bit but remain close to their lows of 2022. We proxy them by looking at IEI and 5-year US Treasuries are trading with a yield of 4.26%.
Finally, long bonds have rallied the most over the past few weeks and have so far managed to stay off their lows.
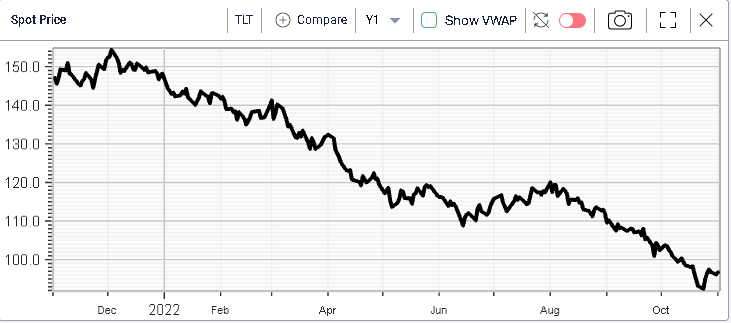
10-year yields are at 4.04% (vs a high of 4.33%) and 30-year yields are at 4.1% (vs a high of 4.42%).
Combining all that information is quite interesting with short dated rates implying further rate hikes while longer dated ones seem to indicate a cap on long-term yields.
This could still indicate that the central view in the market is one where the FED is forced to initiate a recession in the short-run in order to control inflation. The fact that long-term yields remain anchored could arguably be seen as trust by market participants that the FED will do whatever it takes to fix the inflation problem and that it will probably succeed.
Equities
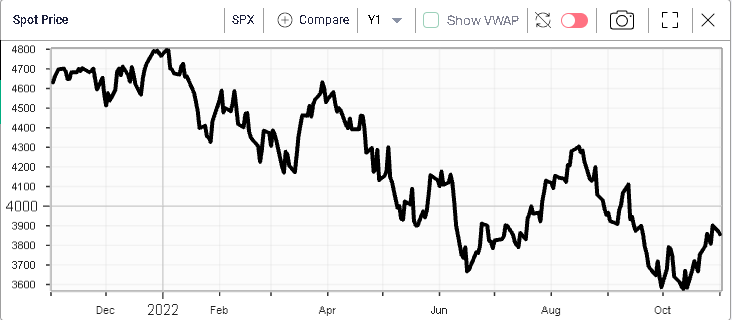
US indices as well as European indices have bounced more than 10% from their lows in October.
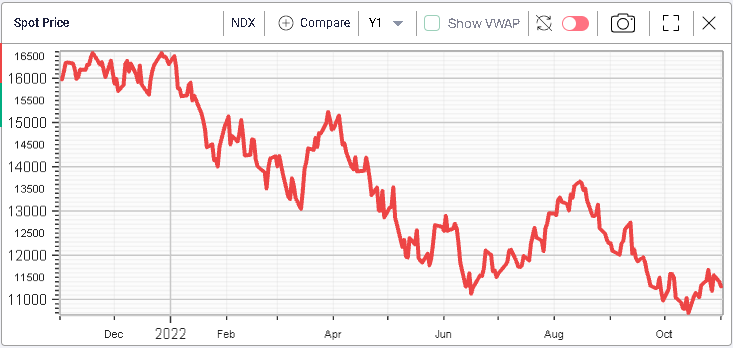
Tech stocks have struggled a bit more as seen in the performance of the NDX but it seems that the earnings season has provided some comfort to investors around the fact that some segments of the economy were holding up pretty well in the current environment.
The Energy sector has performed fairly well over the past 20 days for instance.

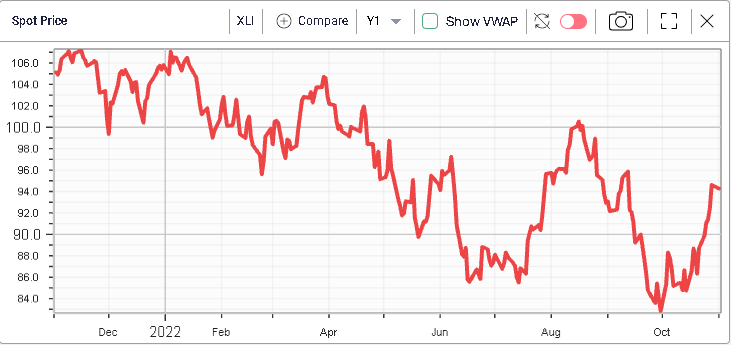
Industrial stocks have also performed relatively well since the SPX bottomed in mid-October.
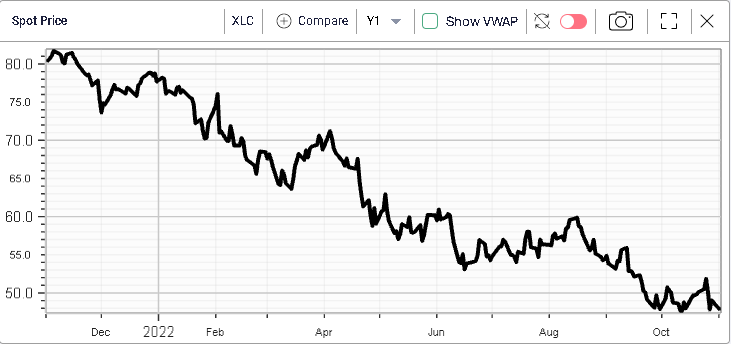
On the downside, communications stocks have struggled following very disappointing earnings.
Overall, Equity markets paint a mixed picture with a potential interpretation being that investors feeling slightly reassured about the recent earnings season that at least for now, the pain is being felt only in a handful of industries and is not yet widespread.
Volatility
Implied volatility has deflated as shown below with the 30d IVX on the SPX.
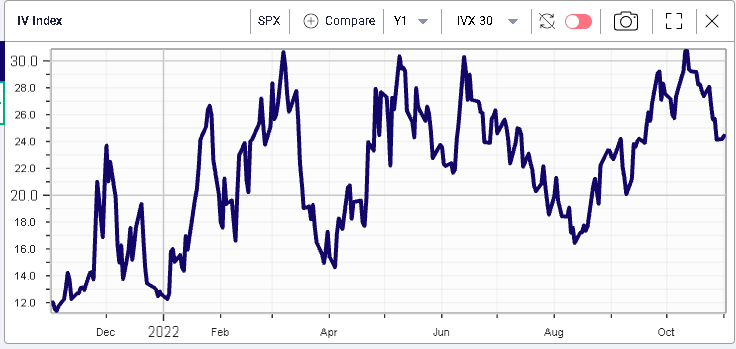
Once again, this could be a sign that traders are getting more comfortable about the predictability of the current market situation. The FED seems to have things under control (at least according to the Fixed Income market) and companies are not under that much pressure (at least compared to what was feared only a month ago).
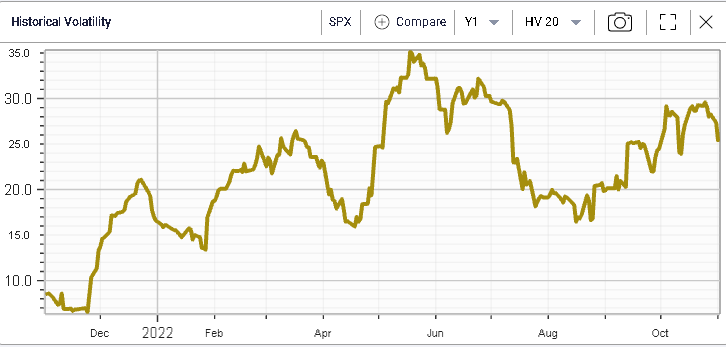
At the same time as implied volatilities have dropped, Historical Volatility has also deflated as seen below with the 20d HV on the SPX.
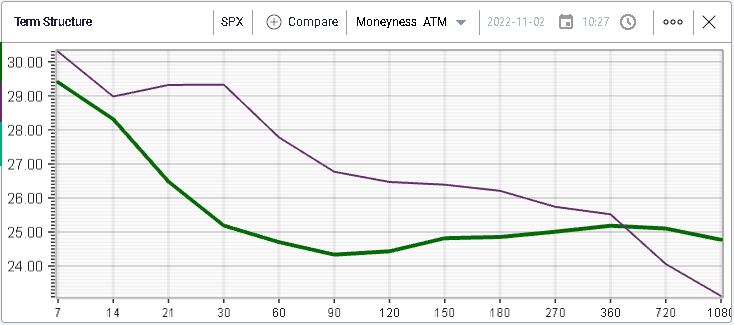
Looking at the term structure of volatility, we note the following:
- In the short-run the market is still expecting a lot of action. This is probably due to the FOMC meeting and the significance of this week from a macro release perspective.
- Intermediate volatilities have dropped the most with 30d IVX moving from 29% to 25%.
- Longer dated IVs have remained fairly steady with some very long-term volatility expectations even increasing.
Is the market pricing a scenario where concerns have been pushed out, possibly in the form of a recession around 2023/2024. In any case, it seems that traders are getting more comfortable with the current situation and the next few months.