Bottom in China or just a bounce?
November 4, 2022
As the large macro releases for this week will end today with the Non-Farm Payrolls report, traders will have to digest all that has happened and been said over the past few days.
Yesterday saw the Bank of England deliver a 0.75% rate hike to bring short term rates to around 3%. The Governor also indicated that the UK was heading for a deep recession according to media reports (Bloomberg) with both the unemployment seen rising and the activity seen contracting over the next few months.
The main news overnight came from China where the HSCEI is up by around 6% on talks that China was set to exist the Zero Covid Policy according to Bloomberg. Following the significant underperformance of Chinese assets in 2022, this rally is most welcomed by bulls.
In Monday’s market update, we highlighted the below chart from tradingview.com that showed that Chinese equities had accelerated significantly lower and even pushed past the main downtrend seen in 2022.
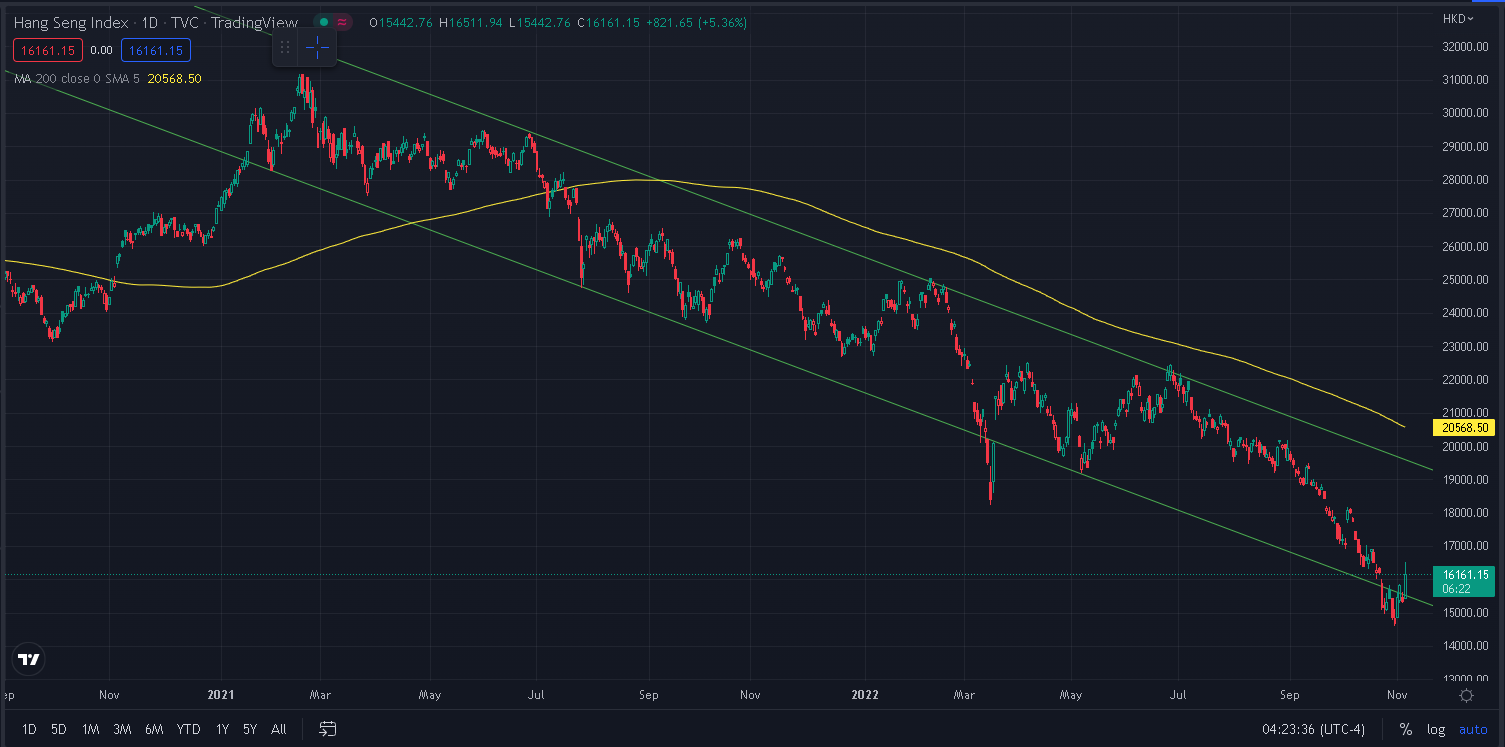
Source: Tradingview.com
The price action has now pushed the index back in the range but the overall performance remains very depressed with a loss of around 30.5% YTD.
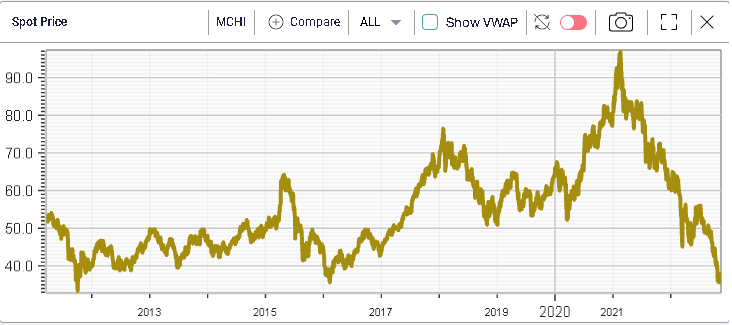
One of the most active US ETFs in the Chinese space is MCHI. Despite the recent rally, it remains very close to the lows although the below does not include the overnight price action that should result in a gap higher off the US open.
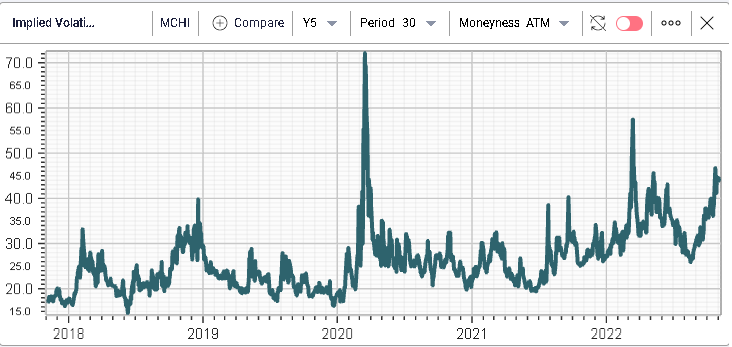
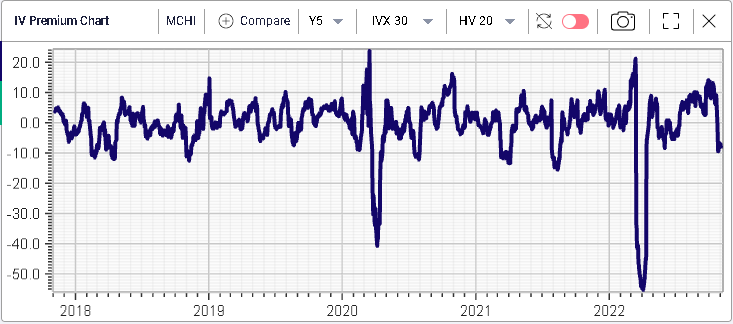
Implied volatility has also remained elevated although at lower levels than seen in March 2022 and March 2020 as displayed below on the 30d IVX chart for MCHI.
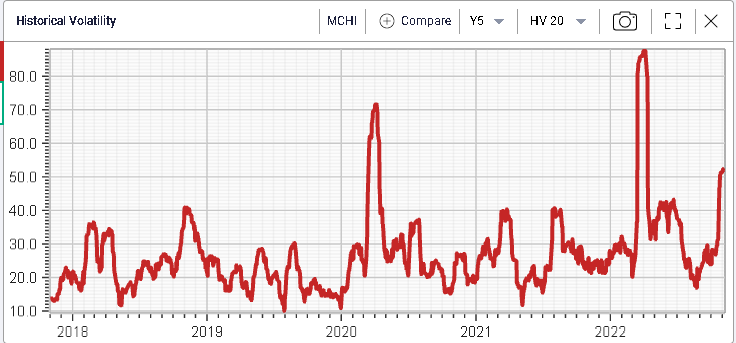
This is probably best explained by the fact that realized volatility has been lower during this selloff than in the past. Below we display the 20d HV for MCHI over the past 5 years. We are seeing HV around 50% compared with a peak in 2020 around 70% and even above 80% in March 2022.
The resulting effect is one where, despite the rise in implied volatility, the IV premium is optically depressed, trading at -10 over the past 5 years.
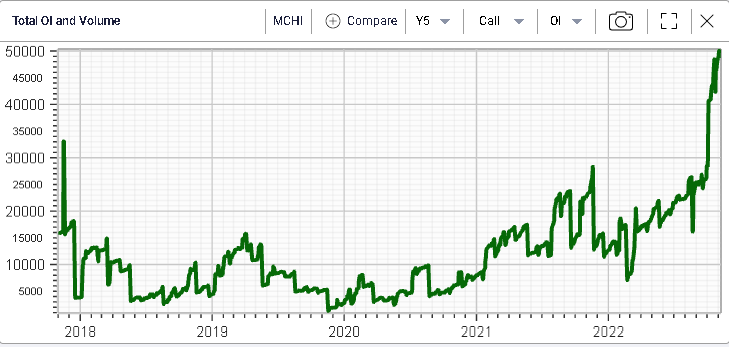
Looking at options volume it is quite important to note that the open interest on the call side has exploded higher over the past few weeks. Below we show the outstanding open interest for MCHI over the past 5 years for calls.
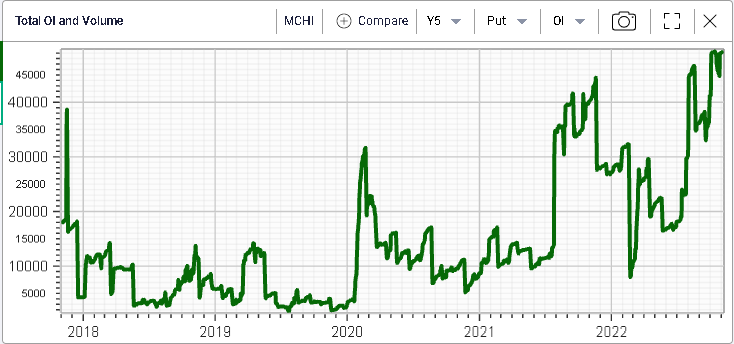
The open interest for puts is displayed below and has increased as well although to a smaller extent.
Amongst the largest outstanding positions, we note the Feb’23 45 calls where around 3,100 lots are opened. The Feb’23 55 calls also have around 2k calls and the May’23 41 calls have 1.4k currently opened.
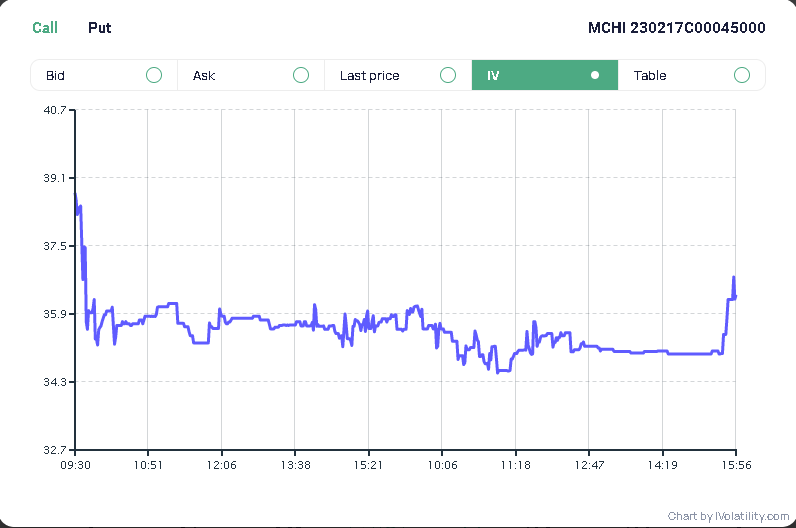
Using the new Single Contract Analyzer service, we build the following chart, showing the implied volatility for the 45 calls with expiration Feb’23. We can see that the IV is around 36% for that strike against a realized volatility for the past 20 days seen above 50%.
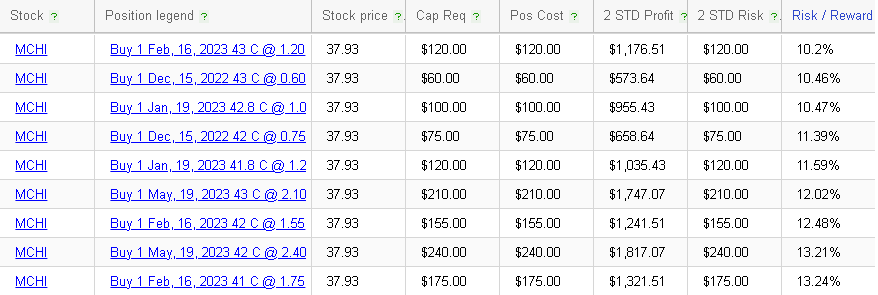
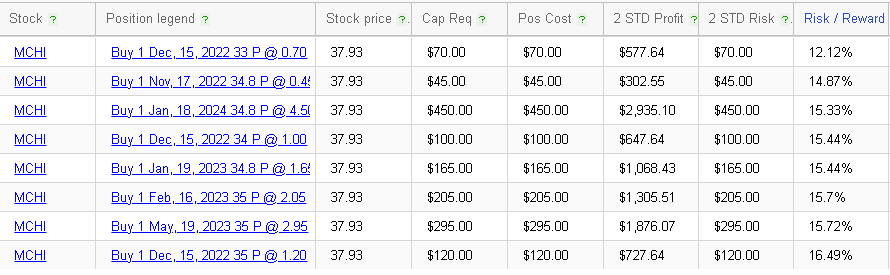
Looking at the RT Spread Scanner for upside and downside strategies, we search for the most attractive naked calls from a risk to reward perspective, as well as the most attractive naked puts. We opt for naked options because the IV premium was seen at -10% but there would be equally valid arguments to look at other types of structures.
On the upside side, it is interesting to note that the most attractive strikes from a risk to reward perspective are the Feb’23 43c which offers a RR of 10.2%. In other words, a trader willing to risk $10c could make a profit of $1 in a 2 standard deviation move in his favor.
On the downside, the most attractive option from a risk to reward perspective is the Dec’22 33 puts offering a 12.12% RR.
Overall, it is interesting to note that the Chinese market is starting to get more and more in play. Following the large capitulation seen over the past month (-15% excluding the overnight rally) this has attracted a lot of interest in those names and we will continue to monitor how things evolve.