More from China and the US but Europe is relaxed
November 7, 2022
Last week saw the release of many highly anticipated macro releases including the FED, the Bank of England and Non-Farm payrolls and resulted in a lot of volatility and significant differences between major global indices.
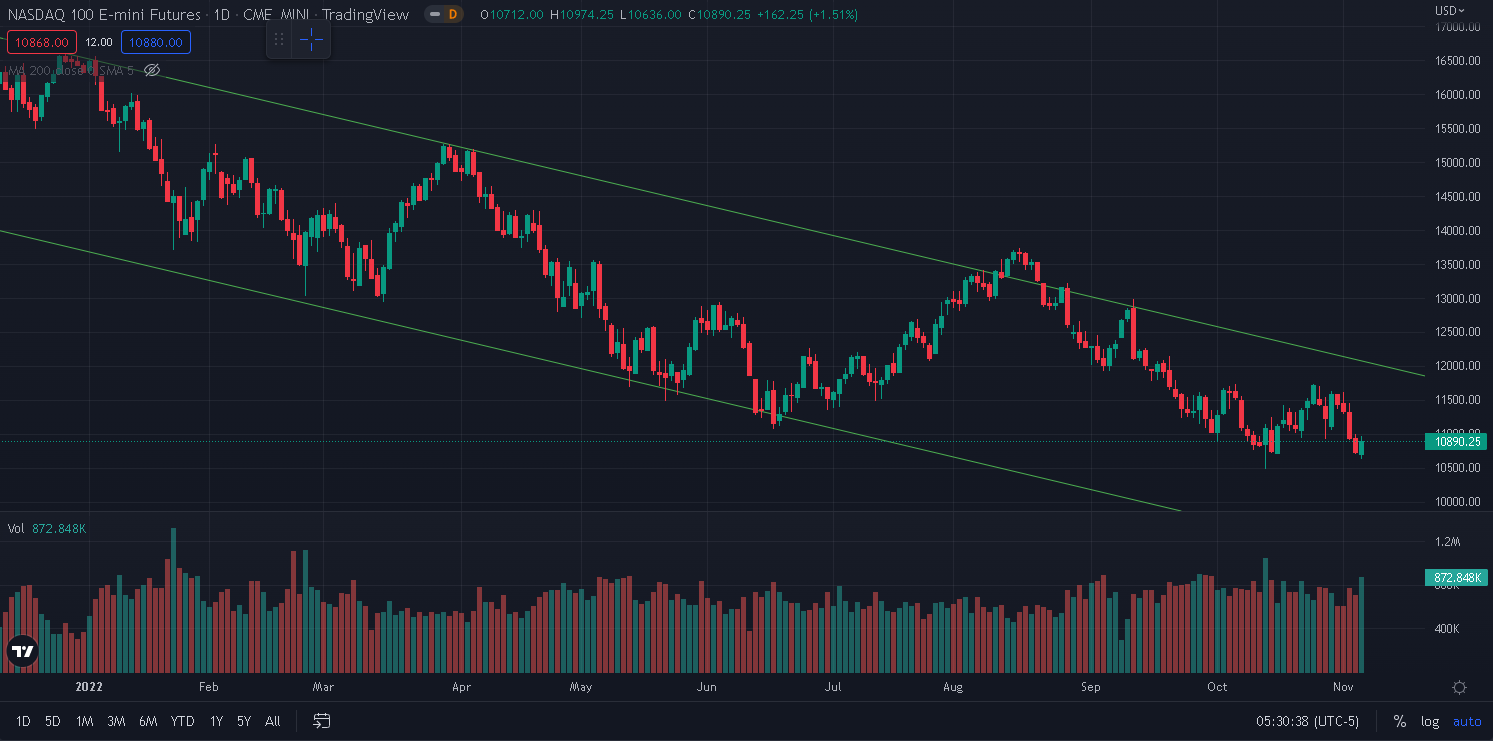
First, we start with the US where indices which were under pressure following the FED’s reiteration of its hawkish message. The pushback against the notion of a pivot in late 2022 by the FOMC was clear and rates reacted accordingly with the 2-year US yield moving from 4.43% on the 28th Oct’22 to 4.66% on the 4th Nov’22.
This resulted in renewed selling pressure for the most speculative parts of the market and communications and technology stocks were particularly affected. As a result, the NDX dropped and finished around 6% lower over the week.
Source: Tradingview.com
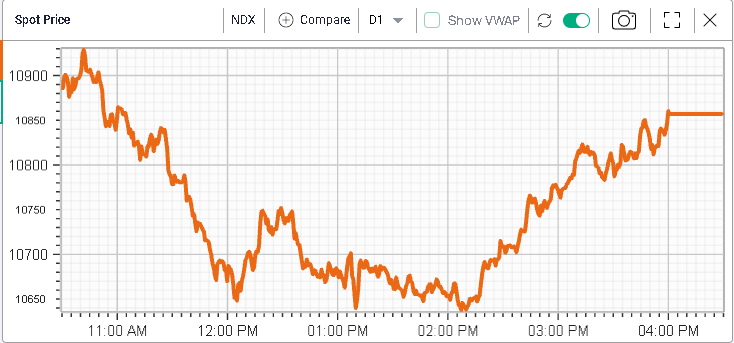
A rally from the lows on Friday of almost 2% helped limit the losses for the week as shown on the below intraday chart.
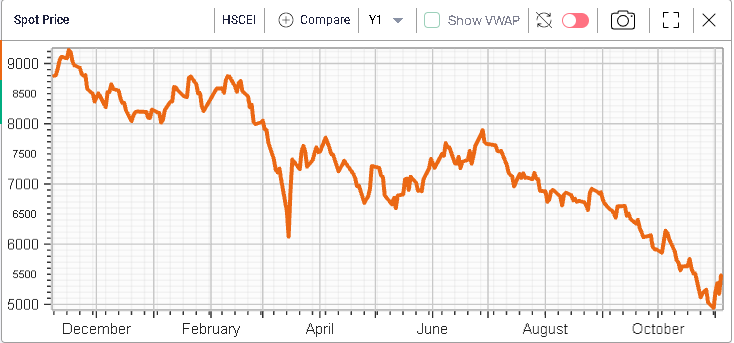
For European assets, things looked slightly more positive with the German DAX gaining around 2% and the French CAC finishing 2.5% higher by the European close. Over in Asia, the HSCEI showed a very strong performance rising more than 8% over the week.
Turning over to implied volatilities, we generally saw a reduction of IVs across all underliers except for the HSCEI.
For the DAX, which finished slightly higher over the week, the 30d IVX lost almost 2 points and 30 days implied volatility for the German benchmark index is now around 20.5%.
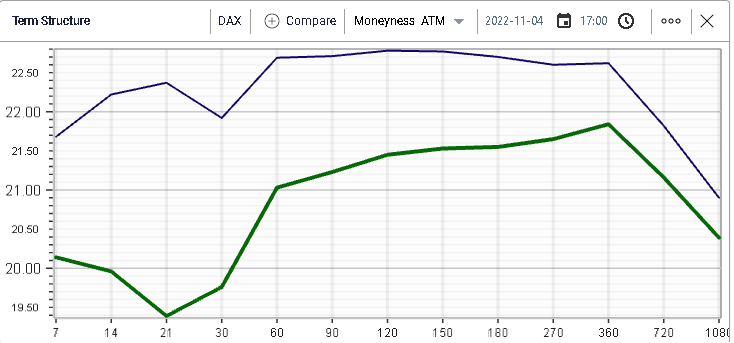
This is the lowest level seen since the summer lows in implied volatility for the index which has traded between 20% and 30% since March 2022.
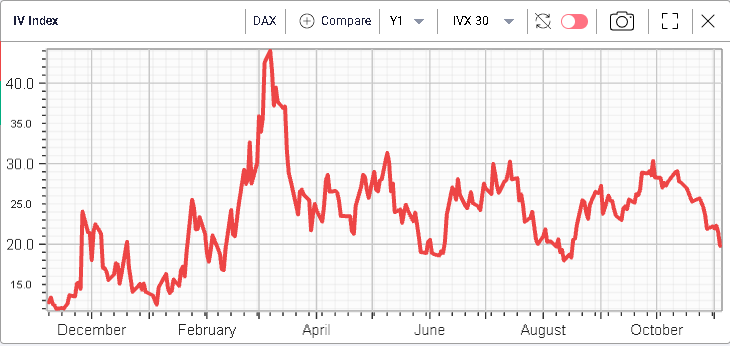
The performance of European assets throughout 2022 has been surprising. The area has been hit by multiple negative developments yet its equity indices have managed to remain very firm. The DAX is now back above 13000 after testing 12000 in early October.
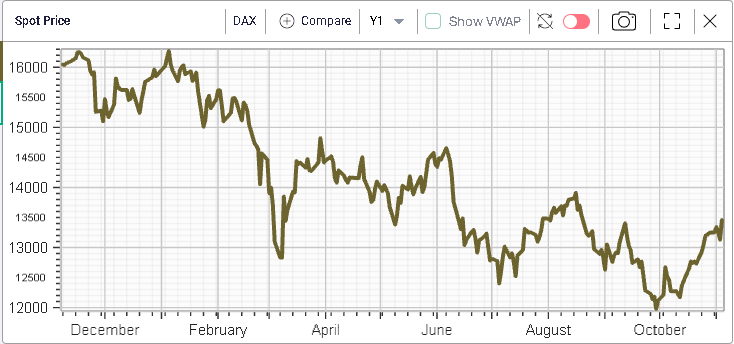
Over the year, the German index has lost 16% which considering all that has happened seems to be quite an achievement. In comparison, the US SPX is down 21.4%.
The resilience in Europe has generally been attributed to the good performance that companies have exhibited in 2022. The large portion that the energy sector represents across Europe has certainly helped support headline indices. Furthermore, the strong USD has allowed companies to report stronger domestic earnings, helping protect and even expand the top-line.
For the SPX, implied volatilities also dropped but to a lesser extent than for the German DAX with the 30d IVX dropping 0.7% over the week.
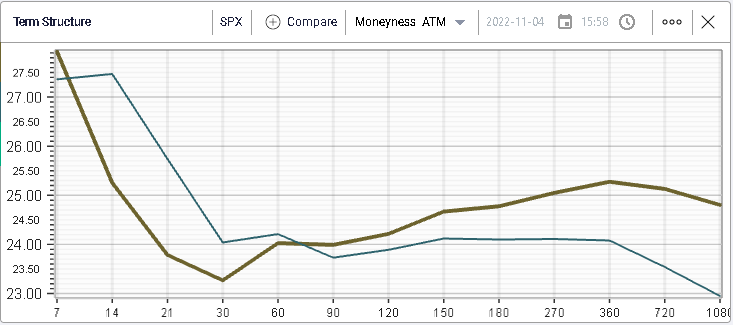
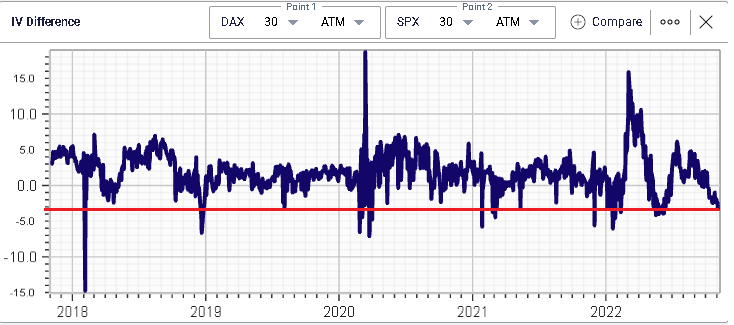
This creates a backdrop where US implied volatilities are now trading at a premium to European IVs, a phenomenon that has been relatively rare over recent history.
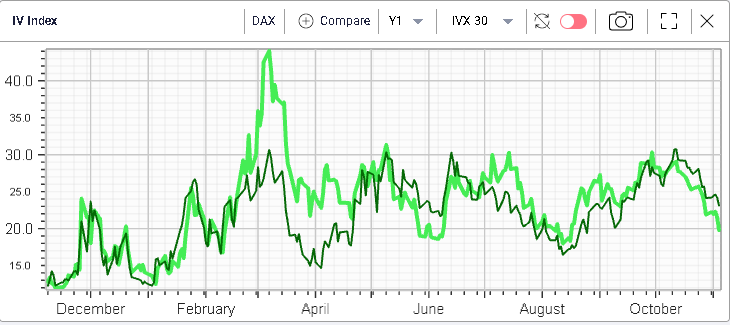
Putting this in historical context, we use the following IV Difference chart from IVolLive that shows how, over the past 5 years, the current discount seen for the German DAX relative to the US SPX has been extremely rare.
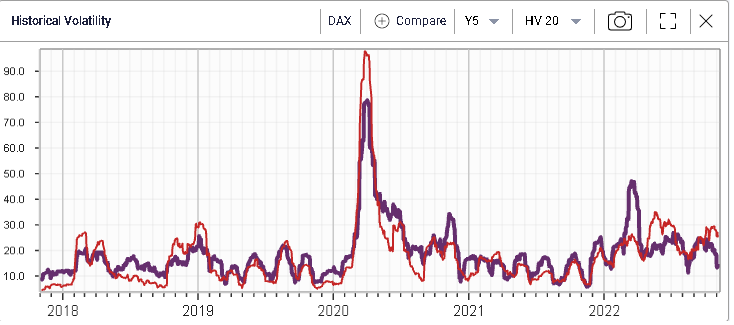
This phenomenon has been first and foremost driven by realized volatilities which, as shown below have diverged meaningfully over the past few months with in red the 20d HV for the SPX and in purple the 20d HV for the DAX.
Looking at Chinese implied volatilities, we can see that, despite the recent rally in spot, options market makers remain cautious with the green line showing the term structure as of the 4th Nov’22 and the orange line showing the TS as of the 28th Oct’22.
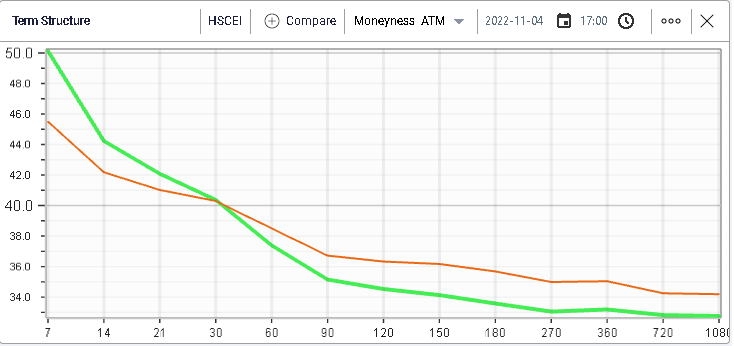
We can see in particular that they are now expecting even more moves in the short run for the index, probably as the market is getting ready for more headlines to drop over the next few weeks.
Interestingly, the 30d IV played the pivot role, unchanged at 40% over the week while longer dated maturities remarked slightly lower.
To sum up, it definitely seems that market participants continue to expect high volatility, first in China but also in the US with a particular focus on the next few weeks. In Europe things look pretty calm for now and the worries have largely subsided.